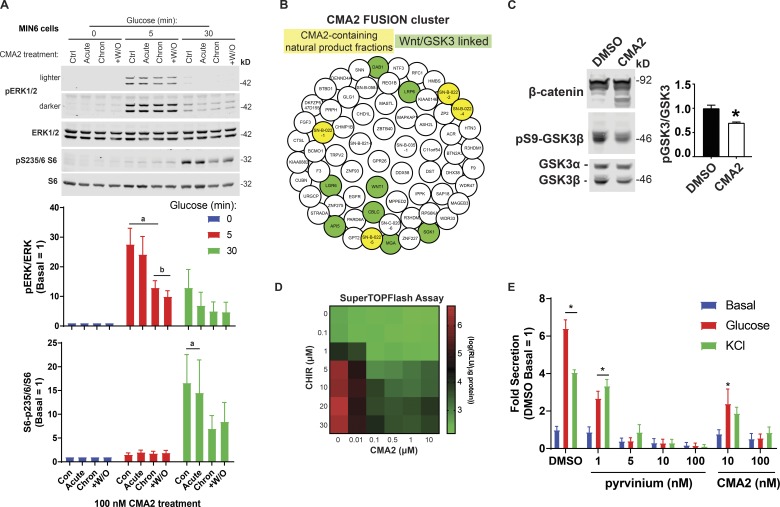
Figure 4.
CMA2 dysregulates β cell signaling through ERK, S6, and the Wnt–GSK3β pathways. (A) The MIN6 cells were treated 24 h with DMSO (0.1%) or CMA2 (100 nM; chronic) and the next day incubated 2 h in KRBH without glucose but containing either DMSO or CMA2. Acutely treated cells received CMA2 only during the 2-h KRBH incubation. Washout (+W/O) were cells treated 24 h with CMA2, which received only DMSO during the 2 h KRBH incubation. Cells were then either unstimulated or stimulated with 20 mM glucose for 5 and 30 min and lysed for immunoblotting against pERK1/2, ERK1/2 and pS235/6-S6, and S6. Bar graphs of quantified immunoblots are shown as the mean ± SEM (n = 3). a, P < 0.05 versus respective 0 min glucose; b, P < 0.05 versus control glucose 5 min by two-way ANOVA. (B) The FUSION cluster of CMA2 and implicated genes. The CMA2-containing natural product fractions are highlighted in yellow, and genes linked to the Wnt pathway are highlighted in green. (C) The MIN6 cells treated 24 h with CMA2 (100 nM) or DMSO (0.1%) showed increased β-catenin degradation bands as well as decreased GSK3β Ser9 phosphorylation, indicating increased GSKβ activity. Bar graph shows GSK3β Ser9 phosphorylation as fold of total GSK3β normalized to DMSO control. Data are the mean ± SEM (n = 3). *, P < 0.05. (D) The Super TOPFlash assay in stable HEK293 cells treated 24 h with different dose combinations of CHIR99021 and CMA2. Displayed data are in log10 format (n = 3). (E) Ins-GLuc MIN6 cells were treated overnight in culture media with the indicated doses of pyrvinium, CMA2, or DMSO followed by a 1-h incubation in glucose-free KRBH and a 1-h stimulation with either 20 mM glucose or 35 mM KCl. Data are the mean ± SEM (n = 3). *, P < 0.05 versus DMSO basal by two-way ANOVA.

