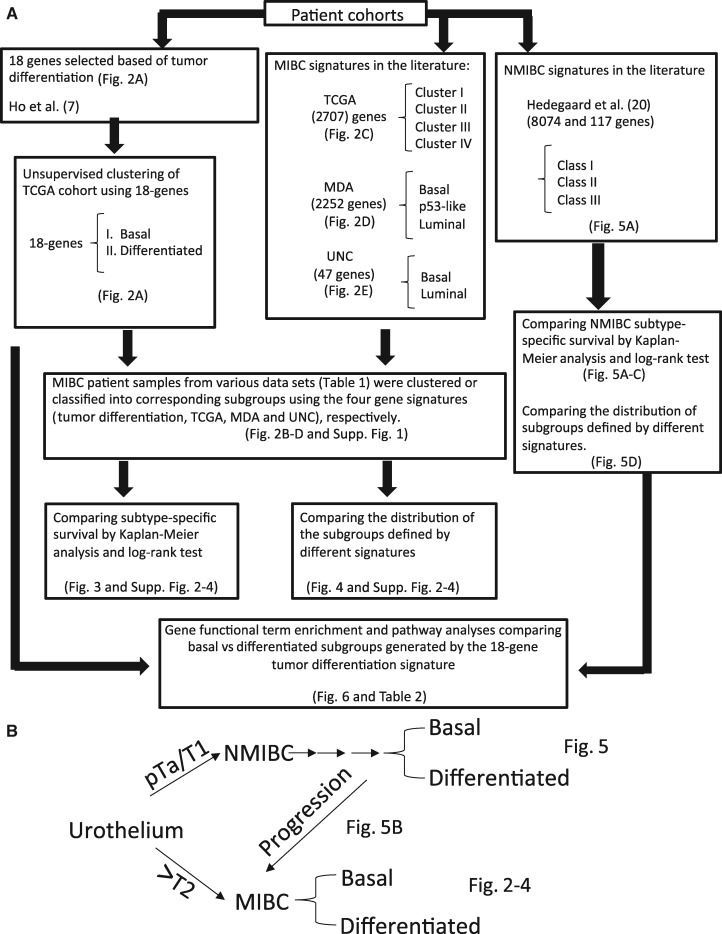
Figure 1.
Flowchart of the current study. A) This figure summarizes the overall rationale and the sequence of statistical analyses performed to generate each of the figures and tables in the current study. B) Schematic of urothelial carcinoma molecular subtypes. MIBC = muscle-invasive bladder cancer; NMIBC = non-MIBC; PFS = progression-free survival.

