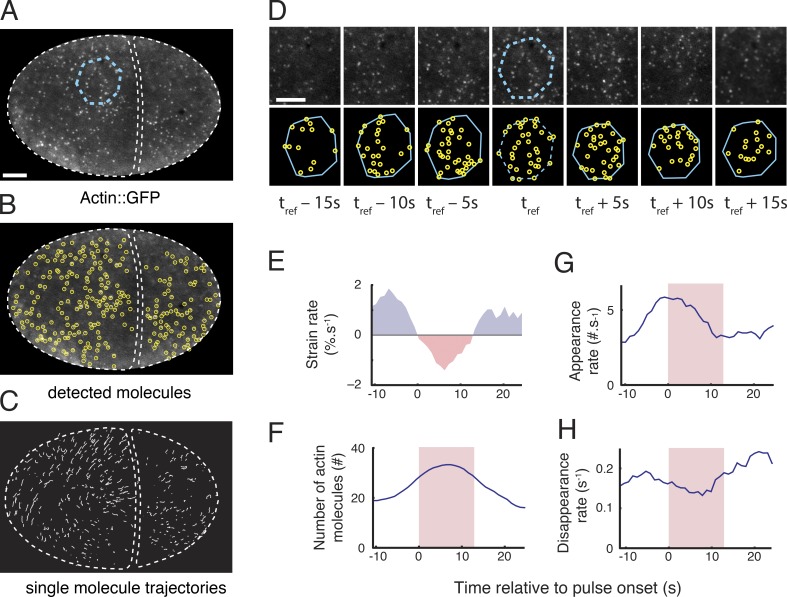
Figure 2.
Single-molecule analysis of actin network assembly, disassembly, and deformation during individual pulsed contractions. (A) One frame of a time-lapse sequence taken from an embryo expressing low levels of Actin::GFP. A patch of cortex undergoing a pulse is identified from the time lapse sequence and outlined in cyan. (B) Automatic particle detection of single molecules from the image in A. (C) Trajectories of the molecules displayed in B that were tracked for longer than 2 s. (D) A polygonal ROI identified at time t = tref, in A (dashed cyan polygon) is propagated forward and backward in time by using the trajectories of tracked particles (see Materials and methods and Videos 2 and 3). (E–H) Simultaneous measurements of single-molecule dynamics and patch deformation over time. (E) Strain rate measured by using the particle-based method (see Materials and methods). (F) Number of actin molecules in the patch. Appearance rates (G) and disappearance rates (H) of actin molecules. Red shading in F–H indicates the time period in which the cortex is contracting locally (strain rate < 0). Bars: (A) 5 µm; (D) 3 µm.

