Figure 5.
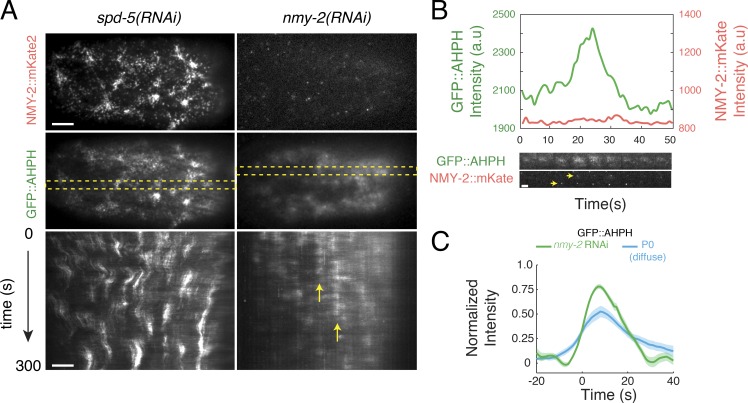
Myosin II is not required for the pulsed activation of RhoA. (A) Comparison of pulse dynamics in zygotes expressing GFP::AHPH and NMY-2::mKATE and treated with either spd-5(RNAi) or nmy-2(RNAi). Top panels show myosin localization (NMY-2::mKATE), middle panels show RhoA activity (GFP::AHPH). Bottom panels are kymographs showing GFP::AHPH dynamics over time. Dashed yellow rectangles in middle panel indicate the regions from which the kymographs were made. Vertical yellow arrows indicate a region undergoing repeated pulses. Intensities were scaled identically for spd-5(RNAi) and nmy-2(RNAi) zygotes. (B) Top: Mean intensities of NMY-2::mKATE (red) and GFP::AHPH (green) versus time for a single pulse in an nmy-2(RNAi) zygote. Bottom: Sequential snapshots of the region undergoing the pulse showing NMY-2::mKATE (red) and GFP::AHPH (green) distributions. Yellow arrowheads indicate the two particles that can be detected in the region undergoing a pulse. (C) Comparison of total GFP::AHPH during pulses in nmy-2(RNAi) zygotes (green curve) with the diffuse pool of GFP::AHPH in spd-5(RNAi) zygotes (blue curve). For each condition, data were aligned with respect to the time at which the normalized signal reached 25% of its maximum value. Data for diffuse AHPH::GFP in spd-5(RNAi) zygotes and wild-type AB cells are identical to those shown in Figs. S4E and 4E, respectively (see Fig. 4 E; Fig. S3, D–F; and Fig. S4 E for details). Data for nmy-2(RNAi) in C were averaged over 101 pulses in three embryos. Shaded areas represent 95% confidence intervals. Bars: (A) 5 µm; (B) 2 µm. a.u., arbitrary unit.

