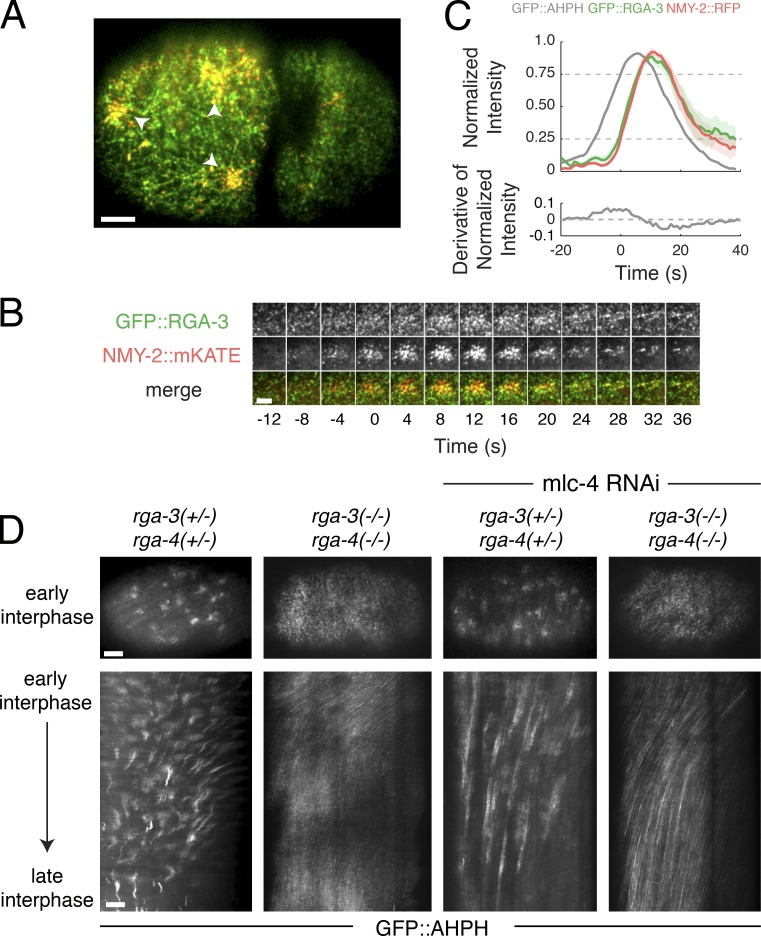
Figure 8.
Delayed accumulation of RGA-3/4 mediates negative feedback required for pulse termination. (A) Micrograph of a two-cell–stage embryo expressing GFP::RGA-3 (green) and NMY-2::RFP (red). (B) Temporal dynamics of a single pulse. (C) Top: Averaged normalized fluorescence intensities versus time for NMY-2::RFP and GFP::RGA-3 from two-color data, coaligned with respect to the time at which NMY-2::RFP reaches 25% threshold. The averaged normalized fluorescence intensity of GFP::AHPH, coaligned with NMY-2::RFP. Bottom: The averaged time derivative of the normalized GFP::AHPH intensity, again coaligned by using NMY-2::RFP. Data were averaged over 31 pulses in four embryos. Shaded regions represent 95% confidence intervals. (D) Top: Distributions of GFP::AHPH during interphase in zygotes with the indicated genotypes. Bottom: Kymographs showing patterns of GFP::AHPH distribution and redistribution during interphase for the same genotypes. Bars: (A and D) 5 µm; (B) 3 µm.

