Figure 9.
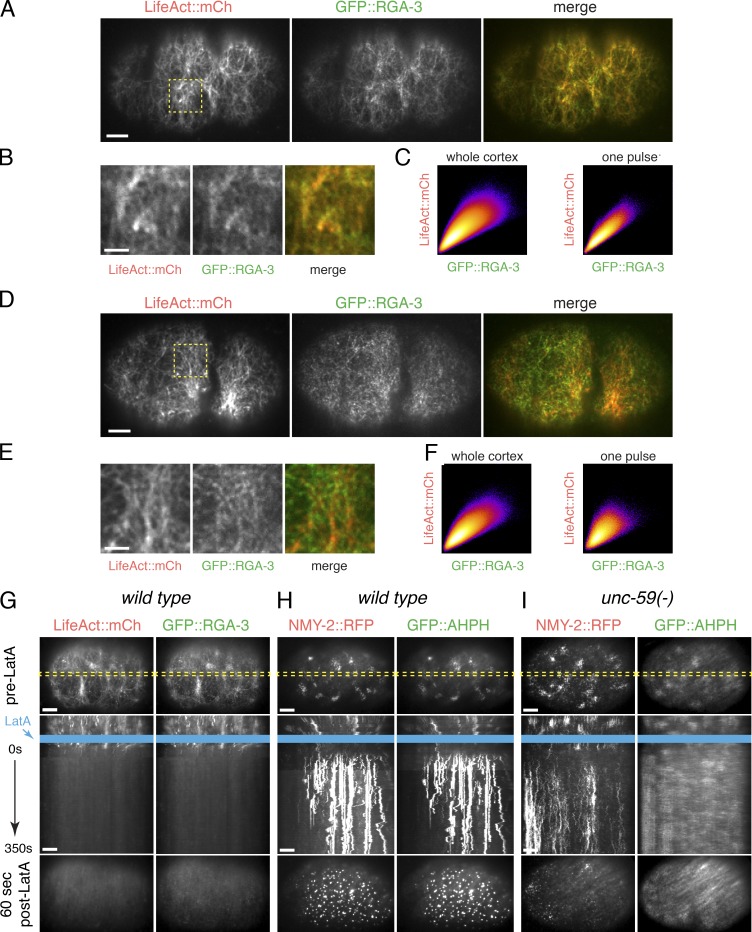
Cortical RGA-3/4 localization depends on F-actin. (A) Micrographs of a zygote coexpressing GFP::RGA-3 and mCherry::LifeAct. (B) Magnified view of the region indicated by the dashed yellow box in A. (C) Scatter plots showing pixel-wise comparisons of GFP::RGA-3 and mCherry::LifeAct intensities for (left) the entire image shown in A or (right) for the duration of a pulse in the ROI shown in B. (D) Micrographs of a two-cell embryo coexpressing GFP::RGA-3 and mCherry::LifeAct. (E) Magnified view of the region indicated by the dashed yellow box in D. (F) Scatter plots showing pixel-wise comparisons of GFP::RGA-3 and mCherry::LifeAct intensities for (left) the entire image shown in E or (right) for the duration of a pulse in the ROI shown in E. (G) Wild-type zygote coexpressing GFP::AHPH and mRFP::LifeAct before (top) and ∼90 s after (bottom) treatment with 10 µM LatA. Middle panel shows a kymograph taken from the region indicated by the dashed yellow box in the top (pre-LA) micrograph. Blue rectangle indicates time of application of LatA. (H) Wild-type zygote coexpressing GFP::AHPH and mRFP::Myosin II before (top) and ∼90 s after (bottom) treatment with 10 µM LatA. Kymograph format as in G. (I) Homozygous unc-59(e261) mutant zygote coexpressing GFP::AHPH and NMY-2::RFP before (top) and ∼90 s after (bottom) treatment with 10 µM LatA. Kymograph format as in G. Bars: (A, D, and G–I) 5 µm; (B and E) 2 µm.

