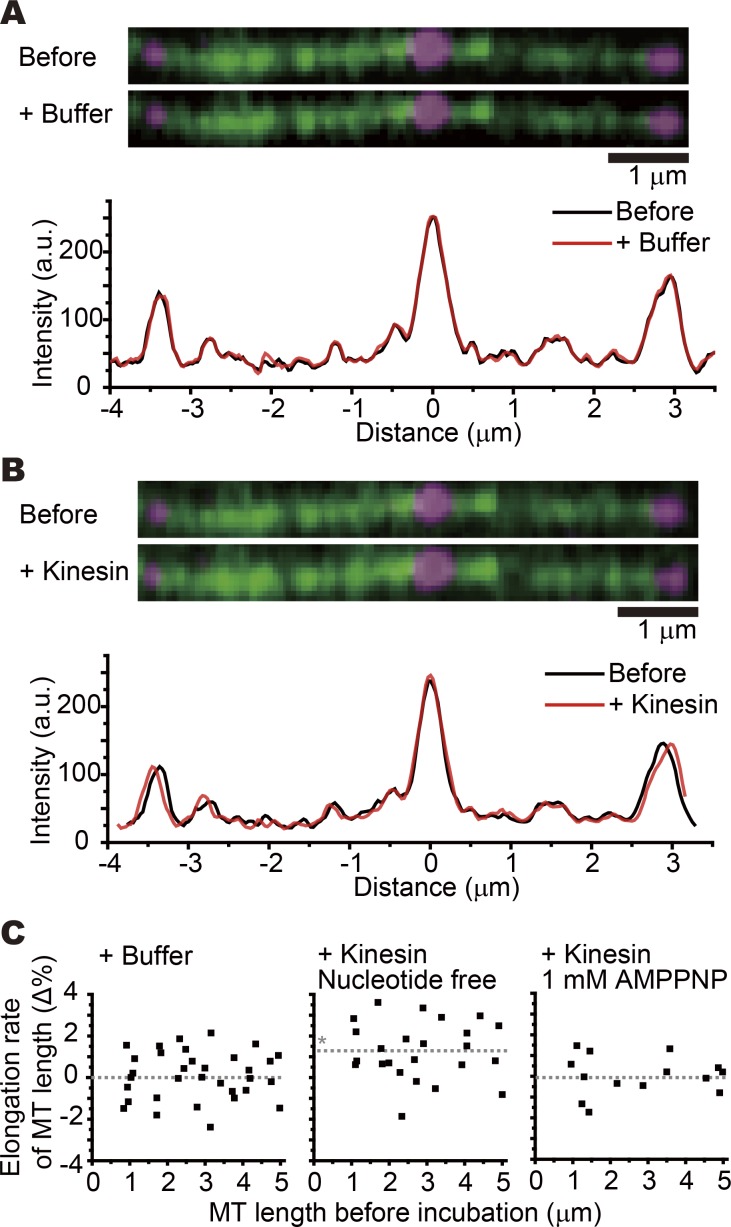
Figure 5.
Single-molecule measurement of the axial elongation of microtubules. Fluorescent speckle microscopy of GDP microtubules showed that KIF5C elongates the microtubule length. Tetramethylrhodamine-labeled microtubules were polymerized from the DY-647–labeled seeds, which were anchored on a glass surface via biotin-avidin linkage. The polymerized microtubules were sparsely labeled with DY-647. (A) Images of the microtubule (green) with the DY-647 speckles (magenta) before (top) and after (middle) introducing buffer in the chamber. The bottom graph shows the fluorescent intensity of DY-647 along the microtubule before (black line) and after (red line) introducing buffer in the chamber. (B) Images of the microtubule (green) with the DY-647 speckles (magenta) before (top) and after (middle) introducing KIF5C in the chamber in the absence of ATP. The bottom graph shows the fluorescent intensity of DY-647 along the microtubule before (black line) and after (red line) introducing KIF5C in the chamber. Bars, 1 µm (A and B). (C) The elongation rates of the microtubule (MT) on introducing buffer (left, Nmicrotubules = 33), KIF5C without nucleotide (middle, Nmicrotubules = 24), and KIF5C with 1 mM AMPPNP (right, Nmicrotubules = 14). The gray dotted lines indicate the mean elongation rate. The asterisk indicates significant difference (P < 0.01, Steel–Dwass test). See also Fig. S2 for the hyperstabilization of GDP microtubules by KIF5C and Fig. S3 for the reversal of the microtubule elongation after removal of KIF5C.

