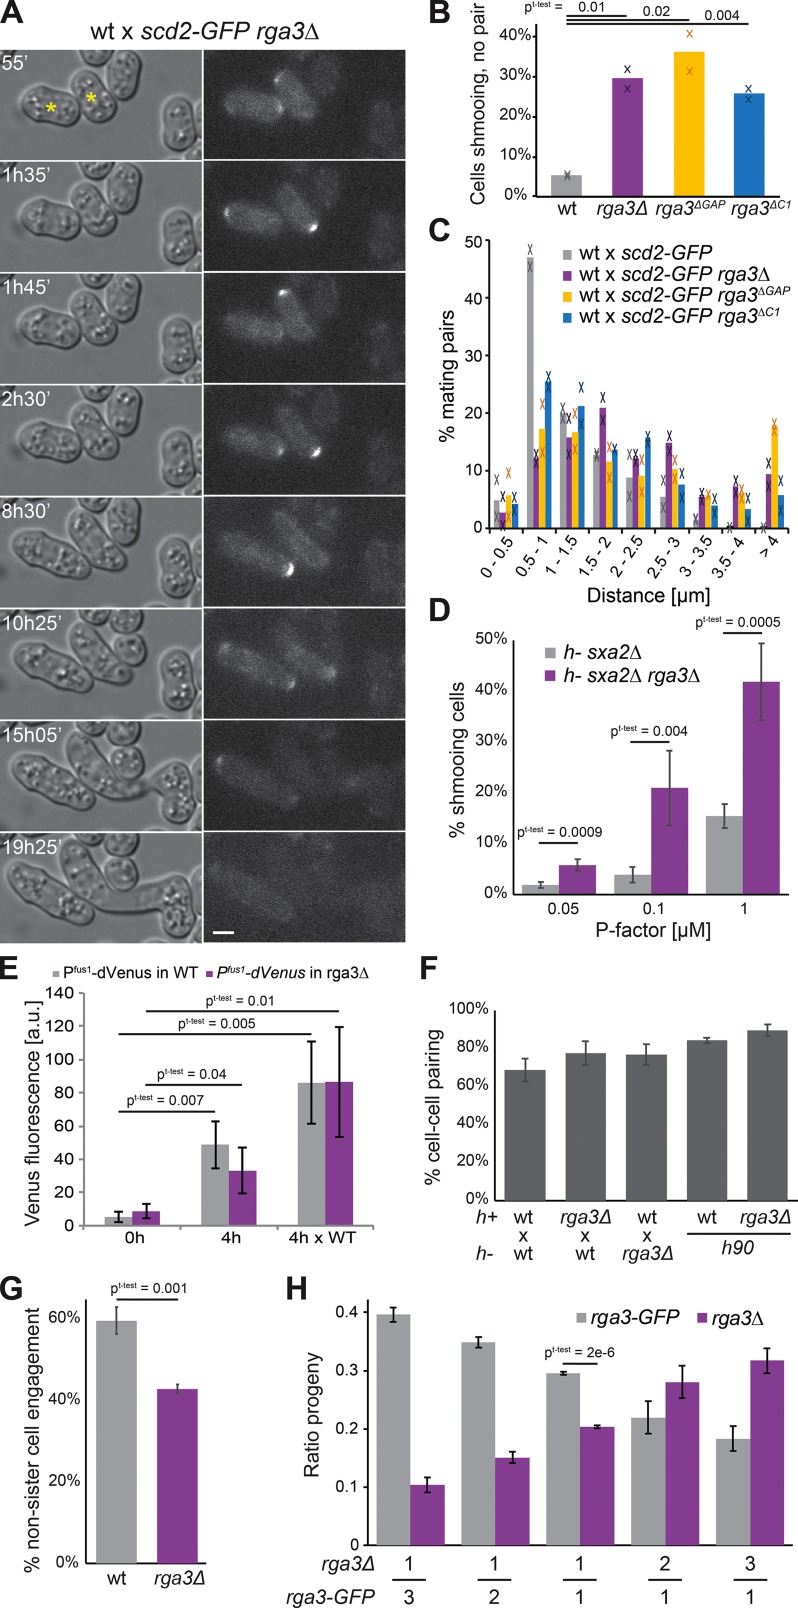
Figure 4.
Rga3 limits growth projection in response to pheromone and confers a competitive advantage during sexual reproduction. (A) Differential interference contrast and Scd2-GFP time-lapse images of h+ rga3Δ scd2-GFP cells mated to h− WT scd2-mCherry (not depicted). Asterisks indicate rga3Δ scd2-GFP cells. Bar, 3 µm. Time is in minutes from start of imaging. (B) Percentages of cells growing a cell projection that does not result in cell pairing in crosses of h+ WT or rga3Δ-expressing Scd2-GFP with h− WT after 20 h on MSL-N pads. Average and individual data points from two experiments with n > 1,000 cells each are shown. (C) Quantification of the distance between partner cells before shmoo formation from mating mixtures as in A. n > 60 in each of two experiments. (D) Percentage of h− sxa2Δ and h− sxa2Δ rga3Δ cells extending a growth projection 24 h after 0.05, 0.1, or 1 µg/ml P factor addition on MSL-N pads. n = 4 experiments with >1,400 cells each. (E) Quantification of fluorescence of a double-Venus transgene expressed under Pfus1 promoter in cells before (0 h) or after (4 h) nitrogen starvation in absence or presence (× WT) of opposite mating type partners. n = 3 experiments. (F) Percentage of cell pair formation of heterothallic and homothallic WT and rga3Δ cells. n > 1,700 in three experiments. (G) Percentage of zygotes formed by two nonsister cells in homothallic WT and rga3Δ cells. n = 3 experiments. (H) Ratio of rga3-GFP and rga3Δ progenies resulting from competitive mating, where an h− WT strain was mixed 1:1 with two h+ rga3Δ and h+ WT strains present in indicated ratios. n ≥ 3 experiments with n > 170 colonies. Error bars show SD. Student’s t test P values are indicated.

