Figure 2.
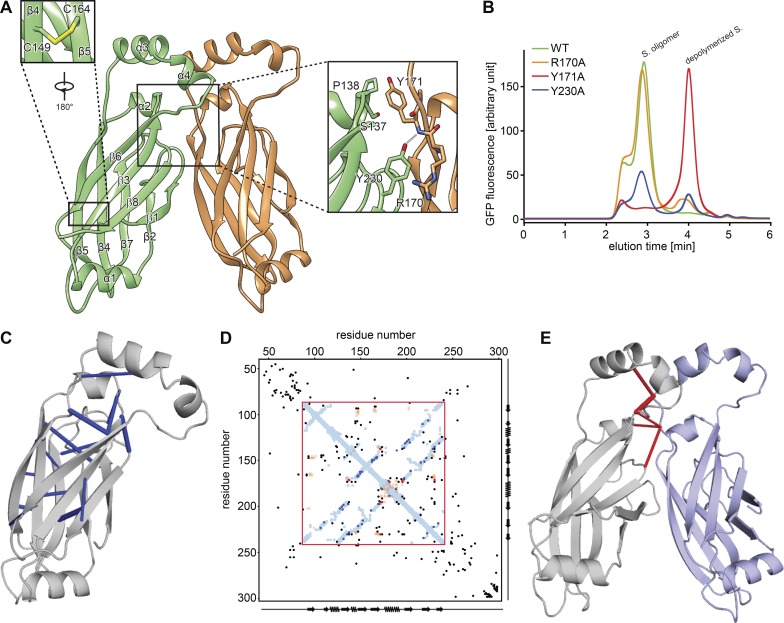
Analysis of a seipin oligomer’s inter- and intramolecular interactions. (A) Model of interactions between seipin monomers. Enlarged views (boxed) show the intramolecular disulfide bond (C149 and C164) and key interactions between monomers. (B) Fluorescence-based gel-filtration analyses of seipin (S.) variants expressed in HEK cells. (C) Molecular model of seipin with significant intramolecular evolutionary couplings (blue) as revealed by evolutionary coupling analysis and folding (EV fold; Marks et al., 2011, 2012). (D) Overlay of seipin’s amino acid evolutionary couplings with distances derived from the molecular model for D. melanogaster seipin. Amino acid positions as well as secondary structure elements are shown on x and y axes. The sequence in the red box represents the cryo-EM structure. Blue and orange dots are residues closer than 5 Å within or between seipin monomers, respectively. Black, blue, and red dots represent the top 125 evolutionary couplings, with the most significant ones observed in the fly seipin structures shown in C (blue) and E (red). (E) Molecular model of seipin with significant intermolecular evolutionary couplings shown in red.

