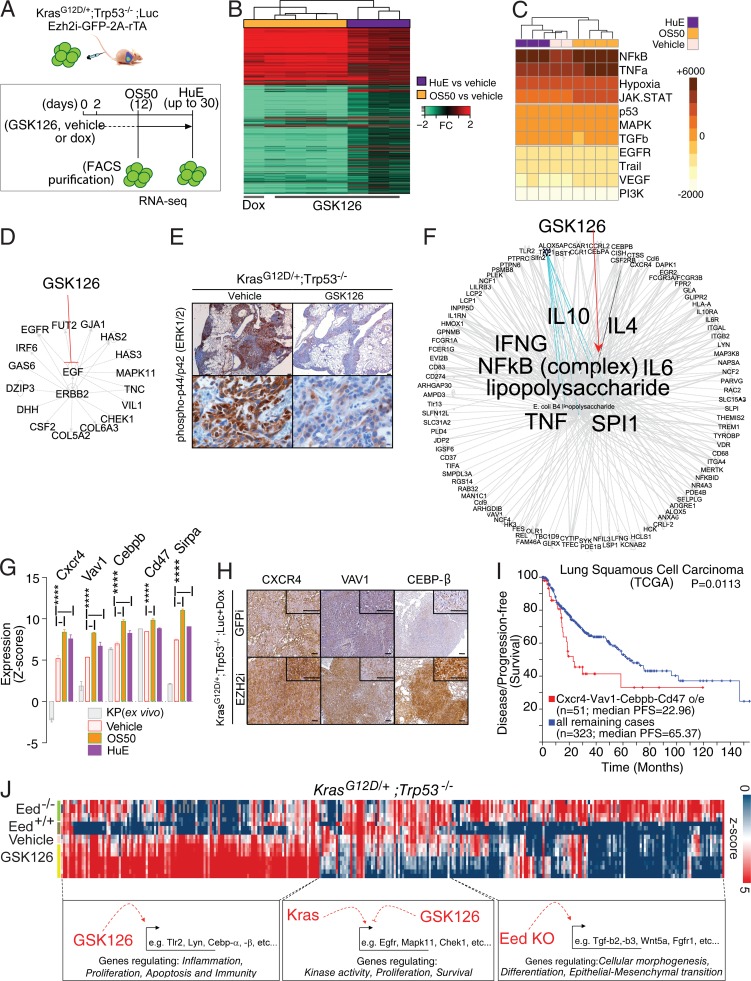
Figure 3.
Ezh2 inhibition promotes the transcriptional amplification of an inflammatory program at the expense of EGFR/ERBB2 signaling. (A) Outline for gene expression profiling of GSK126- or dox-mediated Ezh2 inhibition in KrasG12D/+;Trp53−/−;Ezh2-2A-rTA;Luc lung tumors in vivo upon FACS purification followed by RNA-seq. (B) Heat map illustrating up- and down-regulated genes in animals treated with GSK126 for 10 consecutive days (OS50; n = 4) or until HuE with GSK126 (n = 3) or dox (n = 1). Fold changes (FC) refer to vehicle-treated animals (n = 2). (C) Heat map illustrating pathway activation inferred by PROGENy scores (color) associated with RNA-seq data for GSK126- and vehicle treated animals. Unsupervised hierarchical clustering was based on Manhattan distance. (D) IPA for upstream regulators of genes down-regulated by PRC2 inhibition (counts per million in the vehicle >7, FC < −1.1 in OS50 and HuE). Note the concordance with NF-κB/TNF-α activation by PROGENy. (E) Representative IHC for p-p44/42 in lung tumors with GSK126 or vehicle as validation for EGFR signaling down-regulation as in shown in D. (F) As in D, IPA for upstream regulators of genes induced by PRC2 inhibition in all conditions (n = 212, FC > 1.1). (G) Selected expression data for potential oncogenes and negative regulators of the antitumor immune response. ****, P ≤ 0.0001. P values were calculated by two-way ANOVA and Dunnett post-hoc test. (H) IHC validation of GSK126 up-regulated genes using independent in vivo PRC2 inhibition through dox-mediated Ezh2 ablation. GFP knockdown provided control for shRNA activity. (I) Correlation between disease-free survival and overall survival for patients with high or normal levels expression levels for the indicated genes in the TCGA NSCLC database. Data are from http://www.cbioportal.org/, and the P value was calculated using log-rank analysis. (J) Heat map illustrating expression (color) for genes differentially regulated in GSK126- and vehicle-treated animals as well as in tumor cells freshly derived from autochthonous lung tumors with the indicated genotypes (DESeq2, P < 0.05). Unsupervised hierarchical clustering for genes was based on Pearson correlation. Note the IPA for pathways associated with individual clusters and the concordance with C, D, and F. Scale bars represent 100 µM.

