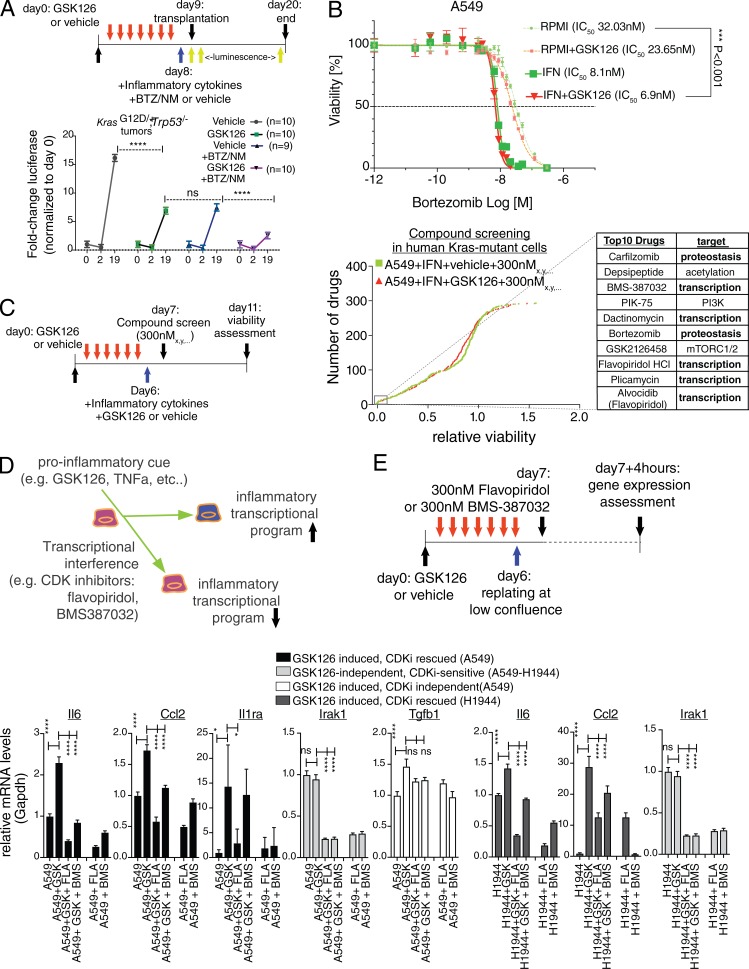
Figure 8.
Control of proteostasis and RNA synthesis links amplification of proinflammatory genes by GSK126 and therapeutic vulnerability. (A) Schematic outline and tumorigenic potential of KrasG12D/+;Trp53−/− mouse NSCLC cells upon in vitro sequential dosing of GSK126, BTZ, and NM. Cells were exposed in vitro for 1 wk to 5 µM GSK126 or vehicle followed by 1 d of inflammatory medium (see Materials and methods). Live cells were orthotopically transplanted into nude mice (n = 9/10), and luciferase expression was measured at the indicated time points. Note that we used an experimentally derived median inhibitory concentration (IC50) for 10 nM BTZ and 50 µM NM because IC50 is >600 µM in mouse and human NSCLC cells. Note the synergism in the sequential GSK126/BTZ+NM (all P < 0.0001). P values were calculated by two-way ANOVA. (B) Proliferation of A549 cells ± GSK126 propagated either in RPMI + 10% FBS or serum-free medium with inflammatory cytokines (see Materials and methods). Assessment of dose response to BTZ 96 h after treatment. IC50 is shown for each condition. Error bars represent mean ± SEM (n = 4, biological replica), and P value was calculated by one-way ANOVA and Dunnett’s post-hoc test. (C) Schematic outline and compound screen in human Kras-driven NSCLC cells. Cells were treated with GSK126 or vehicle as depicted in the schematic outline until seeded into 384-well plates. After 24 h, the compound library containing 293 unique pharmacologically active compounds was added into the plates. Two concentrations were used (30 nM and 300 nM) in three biological replicates. After 4 d, the medium was changed and supplemented with 1/25th of CellTiter-Blue reagent. After 24 h, the cell viability was measured as fluorescence intensity signals with Envision Multilabel Plate Reader. Cumulative frequency distribution plot shows drugs affecting A549 survival from left to right. The top ten drugs (inset) and their names and target processes are listed on the right. (D) A model explaining how control of RNA synthesis is connected to GSK126 amplification of proinflammatory genes. (E) Schematic outline and RT-qPCR assessment response for two independent CDK9 inhibitors from the top ten list in B, flavopiridol (FLA) and BMS-387032 (BMS), in human Kras-driven A549 and H1944 NSCLC cells. Error bars represent mean ± SEM (n = 3, biological replica), and P value was calculated by two-way ANOVA and Dunnett’s post-hoc test. *, P ≤ 0.05; ****, P ≤ 0.0001. CDK, cycline-dependent kinase; CDKi, cycline-dependent kinase inhibitor.

