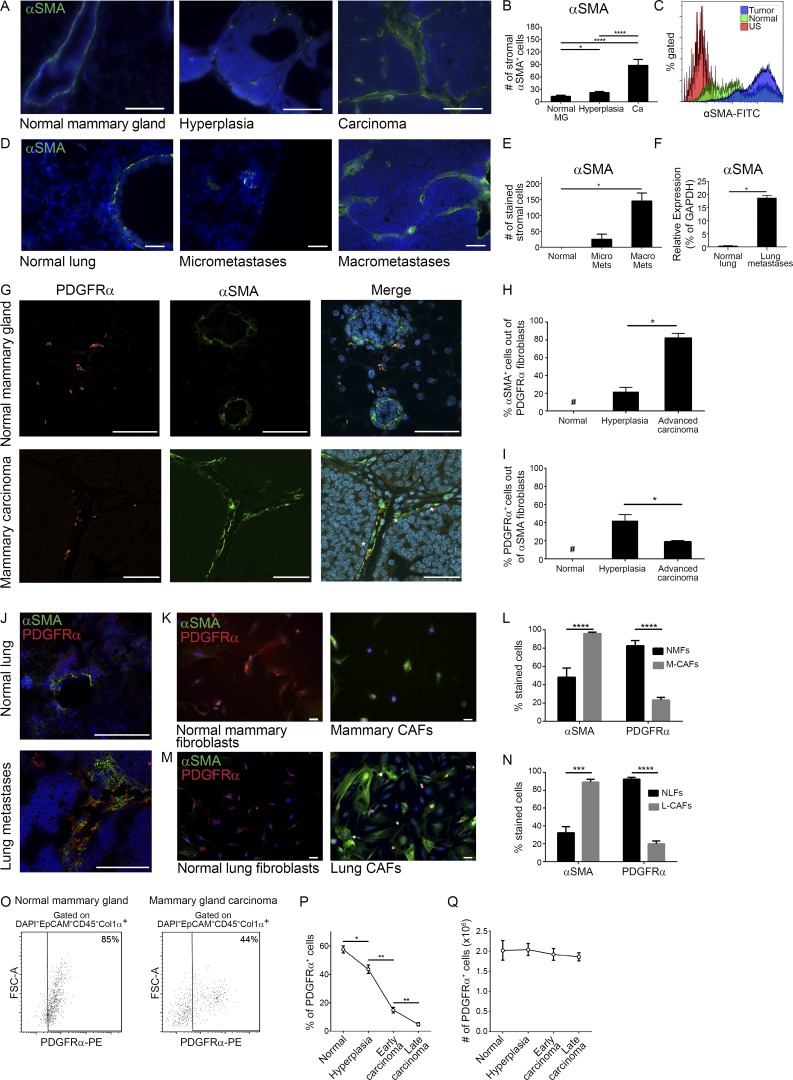
Figure 1.
Mammary and lung fibroblasts are activated during tumor progression. (A) Immunofluorescence of αSMA at distinct stages of mammary carcinogenesis in the MMTV-PyMT model. n = 4 mice at each stage; four sections/mouse were analyzed. Bars, 100 µm. Cell nuclei, DAPI; αSMA, FITC. (B) Quantification of A. Results show mean ± SEM; *, P = 0.02; ****, P < 0.0001; two-tailed Mann-Whitney test. Ca, carcinoma; MG, mammary gland. (C) FACS analysis of αSMA in normal mammary glands and mammary tumors from FVB/n Col1α-DsRed or PyMT;Col1α-DsRed female mice, respectively. Representative of three independent experiments. US, unstained. (D) Immunofluorescence of αSMA in normal lungs (staining mostly around bronchi) and lungs bearing micro- or macrometastases. Representative images of multiple fields analyzed from four mice in two independent experiments. Bars, 100 µm. (E) Quantification of D. Results show mean ± SEM; *, P = 0.028; two-tailed Mann-Whitney test. Mets, metastases. (F) qRT-PCR of PDGFRα+ lung CAFs, FACS sorted from a pool of end stage MMTV-PyMT mice (n = 5) and normal lung fibroblasts pooled from normal mice (n = 6). Error bars represent SD of technical repeats. *, P = 0.05; one-tailed Mann-Whitney test. (G) Co-staining of αSMA and PDGFRα in normal mammary gland or carcinoma. Bars, 50 µm. Asterisks mark double-labeled cells. (H and I) Quantification of αSMA+ cells percentage within PDGFRα+ stromal cells (H) and of PDGFRα+ cells percentage within αSMA+ stromal cells (I) in normal mammary glands and in hyperplasic or end-stage MMTV-PyMT tumors. Results show mean ± SEM. *, P = 0.028; one-tailed Mann-Whitney test. n = 4 mice at each stage; 4 high-power fields were analyzed for each mouse (24 high-power fields total). #, not detectable. (J) Co-staining of αSMA and PDGFRα in normal lungs and lung macrometastases. Bars, 100 µm. n = 2 mice at each stage. (K) Immunocytochemistry of αSMA and PDGFRα in normal mammary fibroblasts or in mammary CAFs. Bars, 50 µm. (l) Quantification of K. Multiple fields (at least six) from four different experiments were analyzed. Results show mean ± SEM; ****, P < 0.0001 for PDGFRα and P = 0.0002 for αSMA; two-tailed Mann-Whitney test. M-CAFs, mammary CAFs; NMFs, normal mammary fibroblasts. (M) Staining as in K of normal lung fibroblasts or lung CAFs. Bars, 50 µm. (N) Quantification of M. Multiple fields (at least seven) from three different experiments were analyzed. Results show the mean ± SEM; ***, P = 0.002; ****, P < 0.0001; two-tailed Mann-Whitney test. (O) FACS analysis of PDGFRα in normal mammary glands and mammary tumors pooled from three mice per group. Representative of two independent experiments. (P and Q) The percentage of PDGFRα+ cells out of CD45− cells (P) and absolute number of these cells (Q) in normal mammary gland and mammary tumors from MMTV-PyMT mice; n = 5 mice in each time point. Results show mean ± SEM; *, P = 0.03; **, P = 0.0079; two-tailed Mann-Whitney test.

