Figure 7.
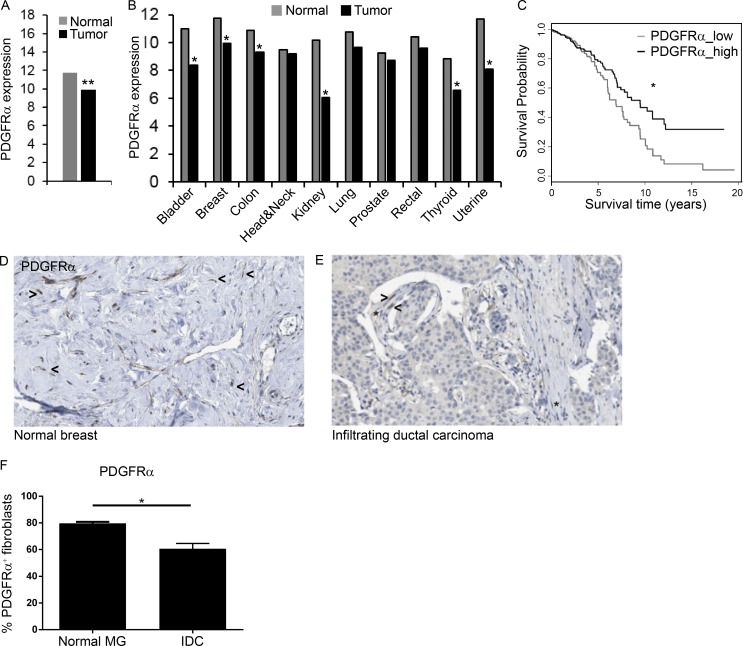
Decreased PDGFRα in human tumors correlates with worse prognosis. Gene expression datasets in 10 diverse cancer types from TCGA and the newer TCGA PANCAN database were analyzed. (A) PDGFRα log2 fragments per kilobase of transcript per million mapped reads expression values in breast cancer patients (n = 649) compared with normal breast tissue (n = 79). **, P < 0.001, Student's t test, and fold-change >1.5. (B) Expression levels of PDGFRα across 10 diverse types of normal and malignant tissues (see Fig. S5 E for details of cohorts). **, P < 0.001, Student's t test, and fold-change >1.5. (C) Kaplan–Meier plot for overall survival rates at high and low expression levels of PDGFRα compared with the median expression (black and gray curves, respectively). Pre-processed and normalized RNA-seq gene expression data from the new TCGA were analyzed (n = 1,215). *, P < 0.05; χ2 test. (D and E) IHC of PDGFRα in tissue sections from human normal breast (n = 2; D) and invasive ductal carcinoma (n = 12; E) retrieved from the Human Protein Atlas. Asterisks, PDGFRα+ fibroblasts; arrowheads, PDGFRα− fibroblasts. (F) Quantification of D and E. Error bars represent SEM. **, P = 0.022; two-tailed Mann-Whitney test. IDC, intraductal carcinoma; MG, mammary gland.

