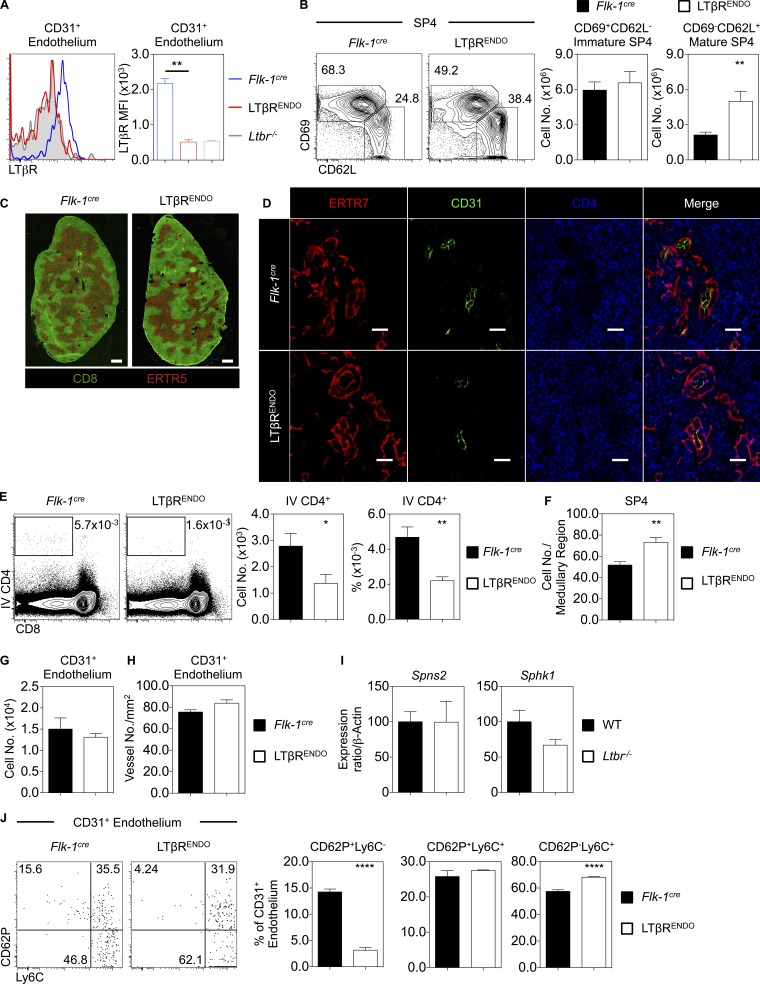
Figure 3.
LTβR expression on the endothelium regulates thymocyte egress via the perivascular route. (A) Analysis of LTβR on TER119−CD45−EpCAM-1−PDPN−CD31+ thymic endothelium in Flk-1cre (blue, n = 6) and LTβRENDO (red, n = 5), where the gray filled histogram indicates staining in an Ltbr−/− mouse. Data are pooled from two independent experiments. (B) CD69+CD62L− immature and CD69−CD62L+ mature CD4+CD8−TCRβHICD25−Foxp3− SP4 thymocytes in Flk-1cre (black, n = 9) and LTβRENDO (white, n = 7). Data are pooled from three independent experiments. (C) Thymus sections stained with anti-CD8 (green) and ERTR5 (red) in Flk-1cre (left) and LTβRENDO (right). Scale bars: 500 µm. Images represent n ≥ 4 mice. (D) Thymus sections from Flk-1cre (top) and LTβRENDO (bottom) stained for ERTR7 (red), CD31 (green), and CD4 (blue) to identify thymocytes around and in the PVS. Scale bars: 20 µm. Images represent n = 3 mice. (E) Percentage and number of i.v. anti-CD4 PE-labeled thymocytes in Flk-1cre (black, n = 6) and LTβRENDO mice (white, n = 6). Data are pooled from two independent experiments. (F) Quantitation of SP4 thymocytes in medullary regions of Flk-1cre (black bars) and LTβRENDO mice (white bars). Data represent mean number of cells counted per medullary area (n = 3 mice per strain). (G) Number of CD31+ thymic endothelial cells in Flk-1cre (black, n = 7) and LTβRENDO (white, n = 6). Data are pooled from two independent experiments. (H) Confocal quantitation of medullary ERTR7+ perivascular-associated CD31+ vessels located within 100 µm of the CMJ in Flk-1cre (black, n = 3) and LTβRENDO mice (white, n = 3). (I) qPCR of indicated genes in purified CD31+ WT and Ltbr−/− thymic endothelium. Data are from three independent repeats. (J) CD62p and Ly6C expression on CD31+ thymic endothelium and percentage of CD62p+Ly6C−, CD62p+Ly6C+, and CD62p−Ly6C+ CD31+ thymic endothelium in Flk-1cre (black, n = 7) and LTβRENDO mice (n = 6). Data are pooled from two independent experiments. An unpaired Student’s t test was used for statistical analysis. All bar charts and error bars represent means ± SEM. *, P < 0.05; **, P < 0.001; ****, P < 0.0001.

