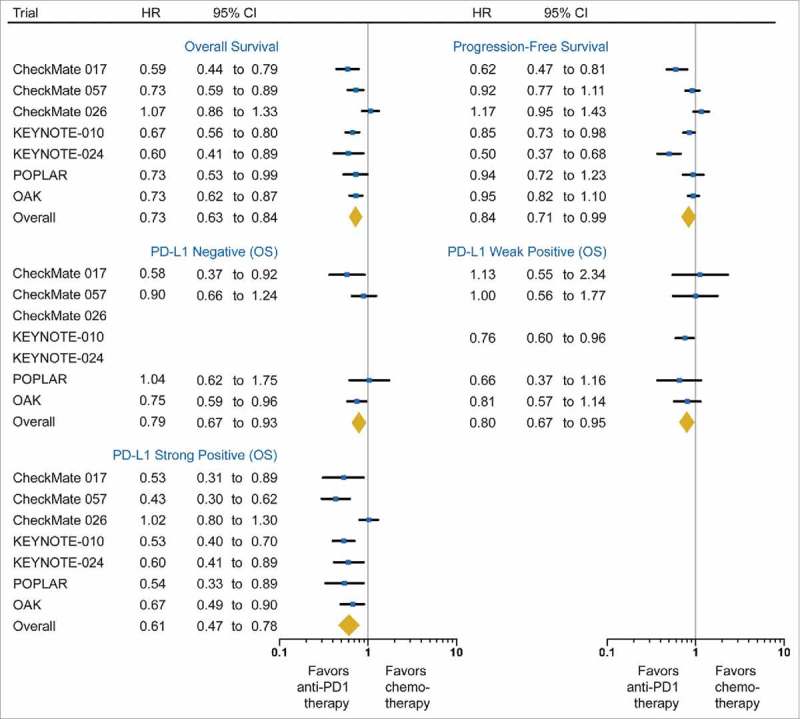
Figure 2.

Forest plot of the effect of treatment on overall survival and progression-free survival in all patients, as well as the effect of treatment on overall survival in subgroups of patients according to PD-L1 expression. Hazard ratios (HRs) for each trial are represented by the squares, and the horizontal line crossing the square represents the 95% CI. The diamonds represent the estimated overall effect based on the meta-analysis fixed effect. All statistical tests were two sided. PD-L1, programmed death-ligand 1.
