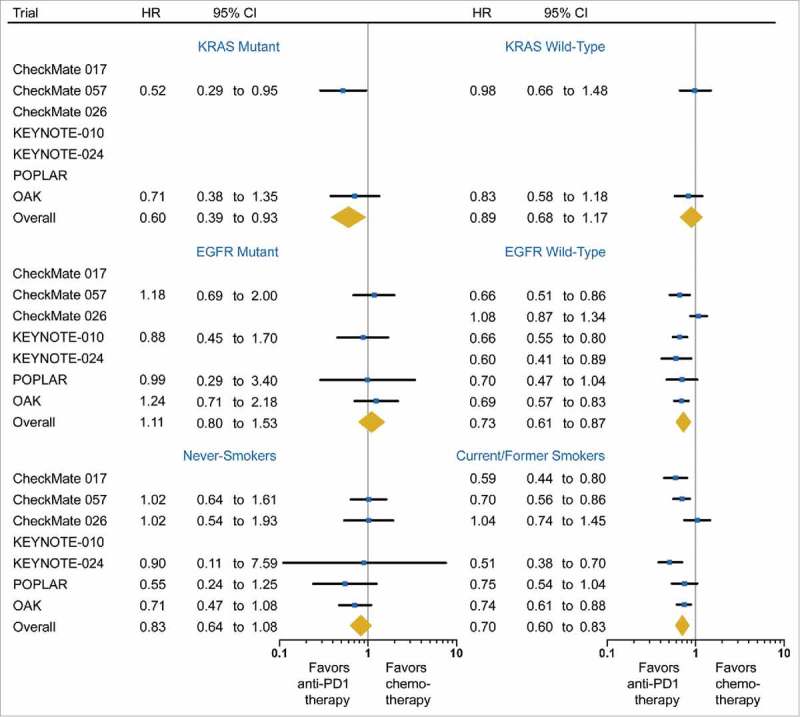
Figure 3.

Forest plot of the effect of treatment on overall survival in subgroups of patients according to mutations of KRAS and the epidermal growth factor receptor (EGFR) gene, and smoking status. Hazard ratios (HRs) for each trial are represented by the squares, and the horizontal line crossing the square represents the 95% CI. The diamonds represent the estimated overall effect based on the meta-analysis fixed effect. All statistical tests were two sided.
