
Figure 3.
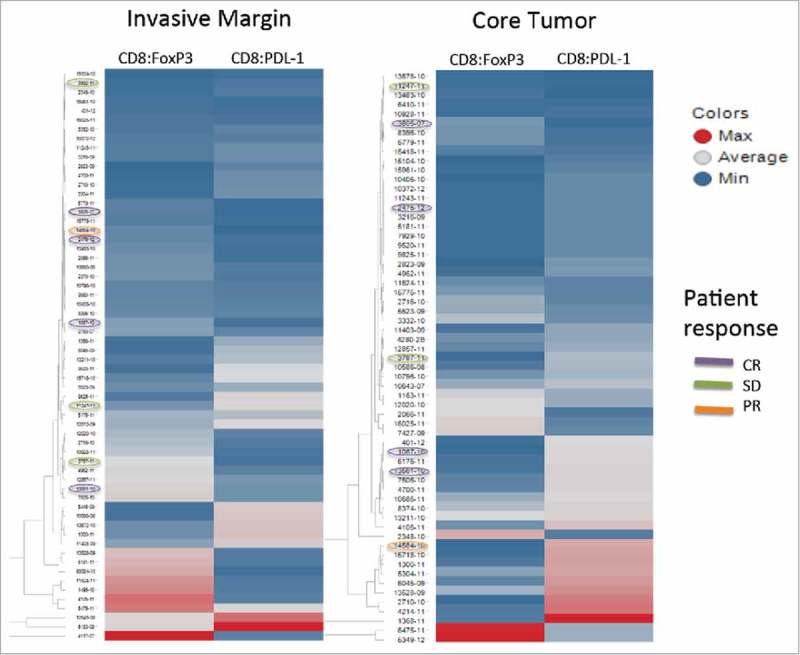
Unsupervised hierarchical clustering. Unsupervised hierarchical clustering of CD8+:FoxP3+ and CD8+:PD-L1+ ratios for the invasive margin (left) and the center of the tumor (right). The color is a continuing spectrum with dark red indicating the maximum ratio and dark blue indicating the lowest ratio. Patient identifiers are shown to the right of each column with patients experiencing either a CR, PR or SD circled with the corresponding color.