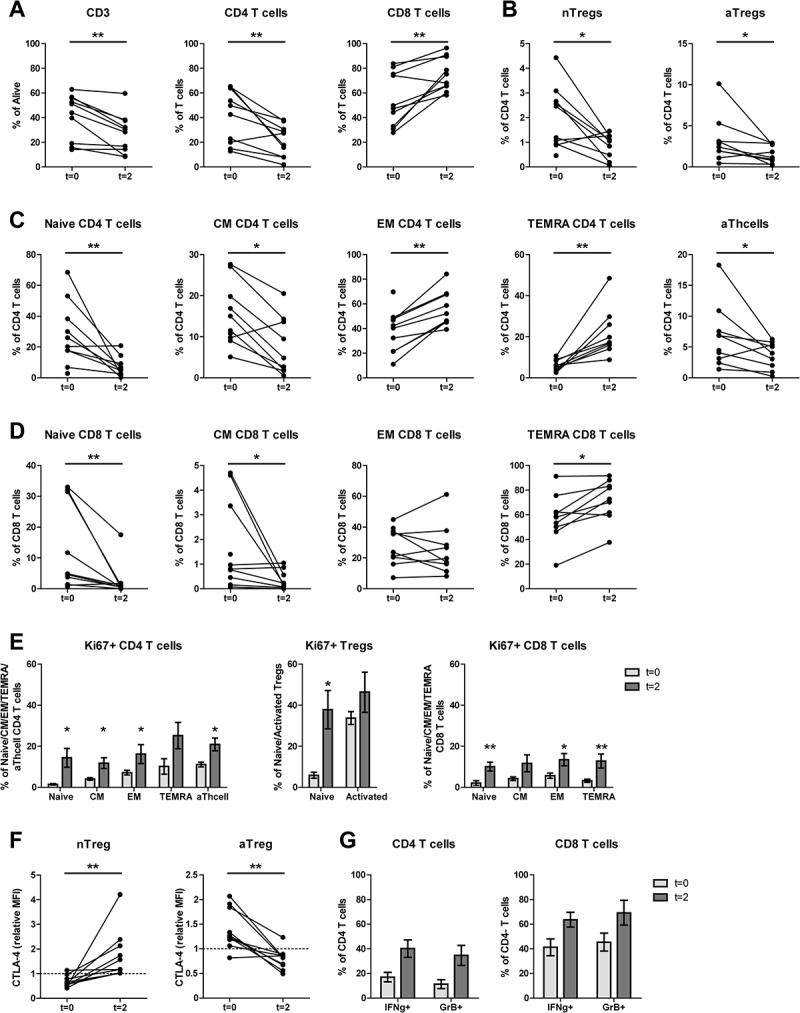
Figure 2.

Both aTregs and nTregs, and other naïve cell subsets decreased upon mCTX administration, meanwhile the percentages of proliferating T cells increased. To determine the effect of mCTX administration on activated and naïve Tregs, and other T cell populations, flowcytometric analysis was performed on PBMCs obtained at t = 0 and t = 2, and thereby comparing baseline proportions with the proportions after mCTX administration. To determine IFN·-production, T cells were stimulated 4hrs with PMA/ionomycin in the presence of monensin. A. The proportion of CD3 T cells decreased (41.14%±5.80 to 27.5%±5.0) significantly upon mCTX treatment, as did CD4 T cells (40.99%±6.81 to 21.28%±4.08). The percentage of CD8 T cells increased (54.73%±6.91 to 74.88%±4.28) significantly. B. Both percentages of naïve and activated Tregs decreased significantly from 1.97%±0.40 to 0.86%±0.17, and from 3.23%±0.87 to 1.52%±0.36 respectively. C. The percentages of naïve (28.12%±6.43 to 7.39%±2.21), CM (15.27%±2.41 to 7.74%±2.35) and activated (6.60%±1.58 to 3.64%±0.73) CD4 T cells decreased significantly, while the percentages of EM (38.25%±5.40 to 56.39%±4.85) and TEMRA (6.38%±0.85 to 21.89%±3.91) CD4 T cells increased significantly upon mCTX treatment. D. The percentages of naïve (12.49%±4.41 to 2.62%±1.87) and CM (1.73%±0.57 to 0.35%±0.13) CD8 T cells decreased significantly, while the percentages of TEMRA (57.6%±5.94 to 71.84%±5.67) CD8 T cells increased significantly upon mCTX treatment. The percentage of EM CD8 T cells did not change (28.19%±3.83 vs 25.19%±5.43). E. Upon treatment with mCTX the percentages of proliferating CD4 T cells increased in the naïve (1.50%±0.34 to 14.4%±4.58), CM (4.12%±0.67 to 11.76%±2.61), EM (7.21%±1.14 to 16.22%±4.63) and activated (11.12%±1.15 to 22.99%±3.17) CD4 T cells subset, but not in the TEMRA (10.23%±3.75 vs 25.22%±6.37) subset. The percentage of proliferating nTregs increased (5.89%±1.48 to 37.80%±9.27), but not of aTregs (33.74%±3.11 vs 46.3%±9.77). In CD8 T cells, the naïve (2.13%±1.15 to 10.07%±2.16), EM (5.71%±1.30 to 13.51%±2.95) and TEMRA (3.28%±0.76 to 12.82%±3.42) cells had increased proliferatioin, but not the CM (4.23%±0.88 vs 11.71%±4.11) subset. F. CTLA4 expression in nTegs and aTregs. The dashed line represents the MFI (mean fluorescence intensity) of CTLA4 in a healthy individual. The MFI of CTLA4 increased significantly in nTregs and decreased significantly in aTregs upon treatment with mCTX. G. The proportions of IFN·-producing CD4 (16.99%±3.83 vs 40.15%±7.05) and CD8 (41.17%±6.77 vs 63.57%±6.04) T cells did not change significantly, neither did the percentage of GrB+ CD4 (11.26%±3.55 vs 34.61%±8.17) and CD8 (45.33%±7.25 vs 69.24%±10.01) T cells. Results represent mean ± Standard Error of the Mean (SEM). *p < 0.05, **p > 0.01 (Wilcoxon matched-pairs signed rank test), differences were considered significant when p < 0.05.
