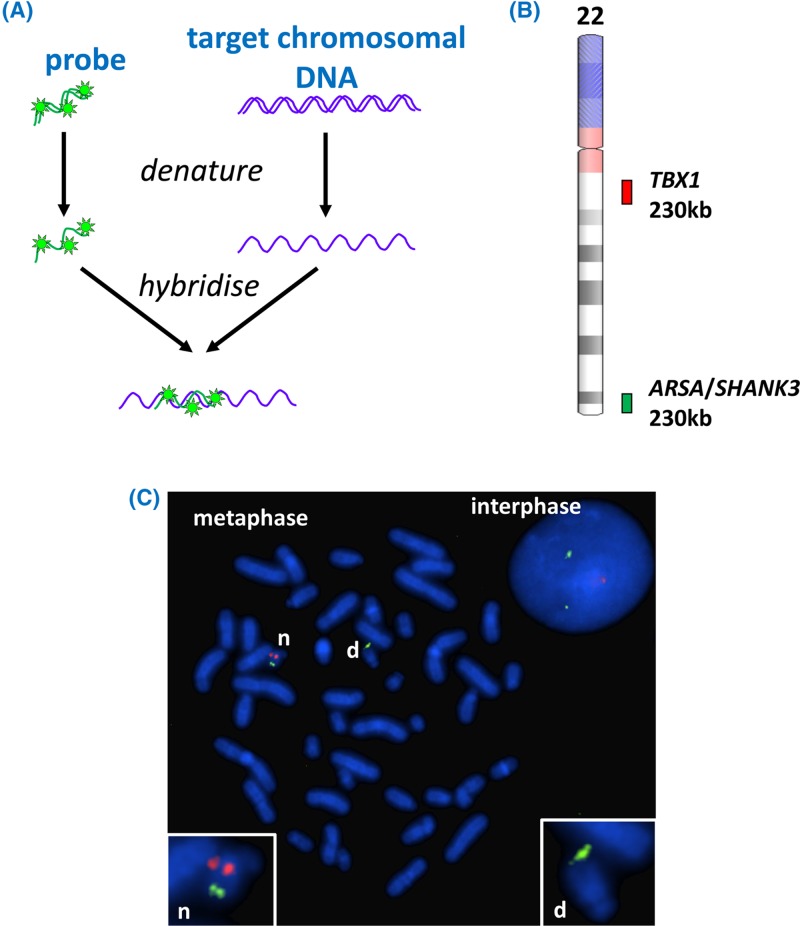
Figure 39. FISH.
(A) One or more fluorescently labelled probes are required for the targets that are to be detected. The patient sample containing chromosomal DNA (which may be cultured cells for metaphase FISH or uncultured cells for interphase FISH) is immobilised on a microscope slide. Probes and chromosomes are denatured and allowed to hybridise together, thus localising the fluorescent probes to the regions where complementary chromosomal DNA is present. (B) Probes for detection of DiGeorge syndrome. One probe (red) targets the DiGeorge locus at 22q11.2 (including the TBX1 gene), and a control probe (green) targeting genes at 22q13 (ARSA and SHANK3) helps to identify both copies of chromosome 22. Note that FISH probes are very long, typically hundreds of kb, in order to render the target detectable; this means that a small deletion may be missed. (C) A fluorescence microscope is used to visualise the results; the image here includes an interphase nucleus as well as a metaphase spread. The chromosomal material has been counterstained blue by DAPI. The normal chromosome 22 is indicated by ‘n’ in the metaphase spread and in the inset; both red and green probes hybridise (the presence of two separate spots for each probe is due to the presence of sister chromatids each possessing a copy of the relevant locus). The chromosome 22 with deletion of the DiGeorge locus (indicated by ‘d’ in the metaphase and inset) shows hybridisation only to the control probe. Note that the interphase nucleus shows only the number of loci present (two green control loci and one red DiGeorge locus), not their location with respect to each other. Note also that in interphase nuclei the chromosomes are very extended so that even loci on the same chromosome become widely separated. FISH image courtesy of West of Scotland Genetics Service. Chromosome ideogram from NCBI Genome Decoration Page.

