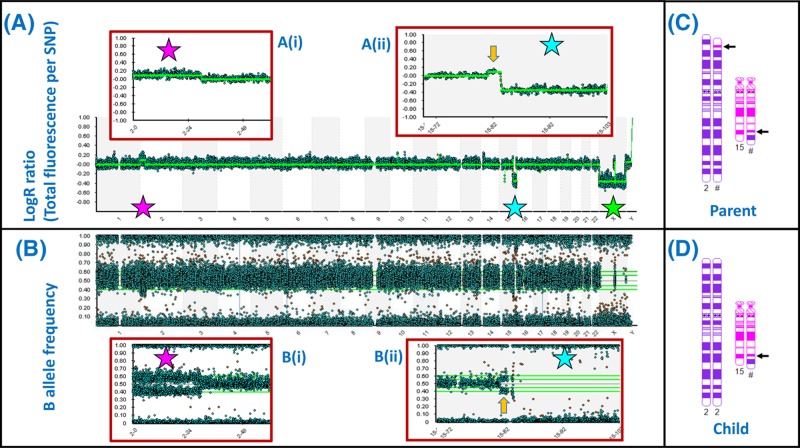
Figure 47. SNP array demonstrates areas of loss and gain across the genome at high resolution.
(A) ‘LogR’ plot for all 22 autosomes and the sex chromosomes demonstrates balanced copy number for most chromosomes. The pink star indicates a duplication (upward shift of LogR) affecting the chromosome 2p terminus, which is expanded in (i). The blue star indicates a deletion affecting the 15q terminus, which is expanded in (ii). The green star indicates apparent loss affecting the X chromosome but this reflects the presence of only one X chromosome in a male. (B) The B allele frequency plot confirms the 2p duplication (i) and 15q deletion (ii); each spot represents the result for a single SNP – there are 843551 SNPs represented in this array. (C,D) The sample in this case came from the child of a balanced reciprocal translocation carrier. The chromosomes 2 and 15 of the parent are depicted in (C), with arrows indicating the breakpoints. The array result indicates that the child received an unbalanced arrangement from this parent: a normal chromosome 2 together with the translocation 15 (D). Note that the array result (A,B) also demonstrates a duplication of chromosome 15 material (yellow arrow) associated with the translocation breakpoint. This would have been below the resolution of a standard karyotype, but is clear from the array result. Small gains and losses can be seen in other chromosomes on close inspection; these may represent CNVs. Array images courtesy of West of Scotland Genetics Service using Illumina CytoSNP 850K Beadchip; chromosome images generated using CyDAS (www.cydas.org).

