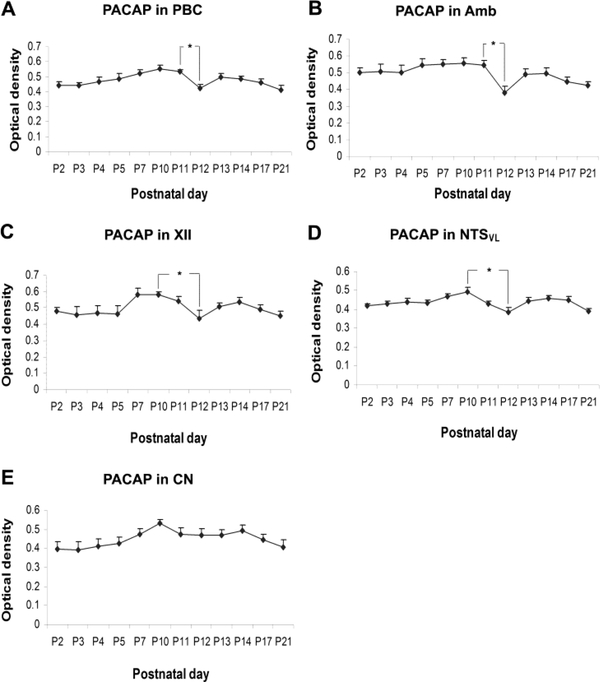
Figure 2.
Optical densitometric measurements of PACAP immunoreaction product in individual neurons of the PBC (A), Amb (B), XII (C), NTSVL (D), and CN (E) from P2 to P21. Data points represent the mean ± SEM. ANOVA revealed significant differences among the ages in the PBC, Amb, XII, and NTSVL (P < 0.01), but not in the CN. Tukey’s Studentized tests showed a significant drop in immunoreactivity from P11 to P12 in the PBC and Amb, and from P10 to P12 in the XII and NTSVL. Other significant differences are indicated in the text. *P < 0.05.

