Abstract
In this paper, we present an iterative reconstruction for photon-counting CT using prior image constrained total generalized variation (PICTGV). This work aims to exploit structural correlation in the energy domain to reduce image noise in photon-counting CT with narrow energy bins. This is motived by the fact that the similarity between high-quality full-spectrum image and target image is an important prior knowledge for photon-counting CT reconstruction. The PICTGV method is implemented using a splitting-based fast iterative shrinkage-threshold algorithm (FISTA). Evaluations conducted with simulated and real photon-counting CT data demonstrate that PICTGV method outperforms the existing prior image constrained compressed sensing (PICCS) method in terms of noise reduction, artifact suppression and resolution preservation. In 24 the simulated head data study, the average relative root mean squared error is reduced from 2.3% in PICCS method to 1.2% in PICTGV method, and the average universal quality index increases from 0.67 in PICCS method to 0.76 in PICTGV method. The results show that the present 27 PICTGV method improves the performance of the PICCS method for photon-counting CT 28 reconstruction with narrow energy bins.
Keywords: photon-counting CT, image reconstruction, prior image, total generalized variation
1. Introduction
Computed tomography (CT) has been widely used in both research and clinical settings because of its high-resolution anatomic imaging. However, a limitation of current CT imaging is the insufficient contrast for soft tissues. The use of an energy-integrating detector (EID) is one of the causes of this limitation as the measured data is proportional to the number of photons integrated 35 across the entire spectrum, negatively impacting the use of energy-dependent information [1]. 36 Improvements in photon-counting detectors (PCDs) for spectral CT [2, 3], also called multi-energy 37 CT, have attracted considerable interest recently.
Dual-energy CT (DECT) is a simple implementation of spectral CT that scans the object with two different energy spectra. DECT has been used in CT scanners in different ways, including dual-layer detectors, dual-source with a dual-detector, and fast kVp switching technique [4, 5]. DECT has a wide range of clinical applications, including automated bone removal in CT angiography, virtual monoenergetic imaging, plaque removal, and the detection of renal stones [6–10]. Photon-counting CT is another approach to implement spectral CT. This technique use a PCD that can resolve energy information of the incident x-ray photons. Unlike conventional EID that integrates the photons across the entire spectrum, the PCD can identify photons with different energy levels and record them in a corresponding energy bin with the given energy thresholds [11–13]. Markedly, the number and width of the energy bins play an important role in photon-counting CT imaging [14, 15]. A narrow energy bin can produce better energy resolution than a wider energy bin; but the quality of narrow energy bin images may be severely degraded because of fewer available photons in the narrow energy bin, if adequate treatment on the noise is not incorporated into image reconstruction [14–21].
Up to now, many efforts have been devoted to suppressing noise in spectral CT reconstruction, including the use of statistical iterative reconstruction methods [14–18, 22–27]. These methods accommodate the imaging geometry and take the statistical characteristics of the measurement into account, with considerable advantage in suppressing noise and artifact as compared with filtered back-projection (FBP) algorithm. Elbakri and Fessler proposed an ordered-subset statistical iterative reconstruction method for spectral CT that considerably reduces the beam hardening artifacts [22]. Sawatzky et al. studied a proximal alternating direction algorithm for spectral CT reconstruction that fully exploits the second-order statistical characteristics of the measurement [23]. Kim et al. developed a penalized maximum-likelihood method using an edge-preserving low-rank regularization for spectral CT reconstruction [24]. These results showed a promising statistical framework to obtain relatively high-quality spectral CT image from noisy measurement. Until now, PCD-based scanners typically still need prolonged projection data acquisition time [19]. One straightforward solution is to reduce the number of projections needed to reconstruct the spectral CT images. However, this reduction will cause severe artifacts in the reconstructed images because the FBP algorithm requires the number of projections to satisfy the Shannon sampling theorem [28–34].
Compressed sensing has recently been evaluated by several groups for spectral CT reconstruction from noisy and incomplete measurement [15, 18, 28, 35–40]. The key for the success of CS is the use of the sparse transform guided by prior information. An example of a common sparse transform is total variation (TV). Inspired by CS theory, various kinds of TV minimization algorithms have been developed for CT image reconstruction. Sidky et al. presented a TV minimization algorithm with projection onto convex set (POCS) for sparse-view and limitedangle CT reconstruction [34]. Integrating a high-quality image into the reconstruction, Chen et al. developed a prior image constrained compressed sensing (PICCS) algorithm for dynamic x-ray CT imaging [28]. Yu et al. presented a spectral PICCS algorithm for photon-counting CT reconstruction that uses the full-spectrum image reconstructed by FBP algorithm as the prior image [15]. Xi et al. proposed a united iterative reconstruction method for spectral CT using structural correlation between different energy bin images [18]. Although promising results have been reported for TV minimization methods, they are usually characterized by staircase effects and patchy artifacts because of the piecewise constant assumption for the target image [41, 42].
To eliminate the undesired staircase effect and patchy artifacts from the TV minimization method, in this study, total generalized variation (TGV) was adapted for photon-counting CT reconstruction. In addition, a prior image reconstructed from broad-spectrum projection data was incorporated into the reconstruction process to explore the correlation between different energy bin images. The novelty of this prior image constrained total generalized variation (PICTGV) method is threefold. First, structural correlations between each narrow energy bin image and high-quality prior image were incorporated into photon-counting CT reconstruction. The prior image is used as a constraint to provide structural correlation information for narrow energy bin image reconstruction. Second, a higher-order derivative of the target image is used in the PICTGV method as opposed to the existing reconstruction methods applied to the images with the firstorder derivative. Third, a splitting-based fast iterative shrinkage-shresholding algorithm (FISTA) is proposed to minimize the associated objective function of the PICTGV method.
2. Material and methods
2.1. Photon-counting CT imaging model
X-ray photons are sorted into several energy bins in photon-counting CT, the intensity for each energy bin is described as follows:
| (1) |
where I (E k ) is the measured data in energy bin Ek , I0 (E) is the intensity of incident x-ray in a photon-counting CT system, µ(x E, ) is the linear attenuation coefficient at energy E and position x along the x-ray path l(x) . Taking the narrow energy bin into account, Eq. (1) can be expressed as follows using the mean value integral formula:
| (2) |
where I0(Ek ) is the intensity of the incident x-ray in energy bin Ek , and is the average attenuation coefficient in energy bin Ek . Therefore, if the width of each energy bin is narrow, Eq. (1) can be approximately formulated as the following discrete linear system:
| (3) |
where H is the system matrix, is the attenuation coefficient at energy bin Ek , and is the projection data at energy bin Ek . The goal of the photon-counting CT reconstruction is to estimate each energy bin image µE from the measurement yE according to Eq. (3).
As opposed to solving Eq. (3) directly, photon-counting CT reconstruction can be formulated as 4 the following minimization problem with a regularization/prior term R(µE ) :
| (4) |
and where denotes the Euclidean norm, β>0 is a penalty parameter that controls the relative contribution from the data fidelity and regularization terms.
2.2. TGV regularization
TGV regularization was first proposed for image restoration, which involves higher-order 10 derivatives of the target image [43]. The second-order TGV can be expressed as follows:
| (5) |
where w is a vector in a bounded domain Ω , ∇ is the gradient operator, denotes the symmetrized derivative, and denotes the l1 norm. The positive weights α0 and α1 control the balance between the first- and second-order derivatives. In this study, we set α1 =1 for compatibility with TV regularization. Moreover, according to our previous work [41], the value 16 α0 = 3 is suitable for TGV-based sparse-view CT reconstruction and does not need to be tuned.
In the definition of second-order TGV, we can find that the second-order derivative will be 18 small in locally smooth areas of the image, and the minimum of Eq. (5) can be obtained with w = ∇µE in these regions. On the other hand, the second-derivative is larger than the first-order derivative in the region of edges, and the minimum of Eq. (5) is obtained with w = 0 . In fact, the argumentation is only intuitively valid, the actual minimum w of Eq. (5) may locate in anywhere between zero and the first-order derivative. This balancing between first- and second-order 23 derivatives leads to satisfactory smooth regions in the image without introducing staircase effect.
2.3. PICTGV reconstruction
The PICTGV reconstruction consists of two steps: (1) reconstruct a high-quality prior from an 26 integrated projection data, and (2) incorporate this prior image in to TGV regularization based 27 narrow energy bin image reconstruction.
Let be the integrated measurement (projection before logarithm transformation) of all energy bins. The prior image µp can be reconstructed form the broad-spectrum projection data (projection after logarithm transformation) using the TGV based iterative reconstruction:
| (6) |
where y = ln(I0 (E)E /Y0 ) , which contains all x-ray photons of the spectrum.
Then, incorporating the prior image µp into TGV regularization, we propose the following PICTGV regularization:
| (7) |
where λ∈[0,1] is a scalar that controls the balance between the first and second terms in Eq. (7). The structural correlation information from the prior image µp is embeded into narrow energy bin image µE via the subtraction operation µE − µp In order to mitigate the effect of the different scales in the image µp on the target image µE , the TGV objective function TGV was incorporated into the PICTGV regularization with a relative weight of 1−λ.
Based on the PICTGV regularization, the cost function for photon-counting CT image 9 reconstruction can be formulated as:
| (8) |
2.3. Numerical algorithm
2.3.1. General FISTA.
Details of the general FISTA [44], adopted to minimize the problem (4), is described in Table 1. Basic steps of the FISTA can be summarized as follows. First, an intermediate image f k+1 is obtained using a gradient descent step. This intermediate image usually contains noise and artifacts because no regularization is performed. Then, the regularization R(µE ) is used to effectively reduce noise and artifacts.
Table 1.
Workflow of the general FISTA.
| Algorithm of general FISTA. |
|---|
| Input : The Lipschitz constant L is set to be the maximum eigenvalue of the maxtrix HT H. |
| Initialization : Take d0 =0, =0, =1 and k = 0. |
| While stop criterion is note meet |
| End if stop criterion is satisfied. |
2.3.2. Splitting-based FISTA.
The FISTA used to minimize problem (4) cannot be directly applied 19 to solve problem (8), as there are no efficient algorithms can be directly applied to solve the 20 following composite minimization problem:
| (9) |
To circumvent this difficulty, we decompose the associated minimization into two sub-problems by the composite splitting approach [45]:
| (10) |
| (11) |
Two positive scalars m1 and m2 satisfy m1 + m2=1 , and we set m1 =m2=0.5 . After obtaining the solutions of the sub-problems (10) and (11), an average of those two solutions is computed. Under the conditions described in a previous study [45], this splitting-based approach will converge to the solution of the problem defined in equation (9). Sub-problems (10) and (11) can be solved by the 8 previously described prime-dual algorithm in [41, 46]. The number of iterations for each sub9 problem plays an important role in obtaining a satisfying result. In experiments, we found that 10 10 iterations for each sub-problem is enough to obtain a convergent result.
In summary, the implementation of the splitting-based FISTA for the PICTGV minimization problem (8) is described in Table 2. In this study, the PICTGV method is terminated when the 13 relative change between two successive iterates is small enough, that is,
| (12) |
Table 2.
Workflow of the splitting-based FISTA.
| Algorithm of splitting-based FISTA. |
|---|
|
Input : The Lipschitz constant L is set to be the maximum eigenvalue of the maxtrix HT
H. |
| Initialization : Take d0 =0, =0, =1, m1 = m2 = 0.5, and k = 0. |
| While stop criterion is note met |
| End if stop criterion is satisfied. |
The iteration is also forced to stop when the number of iterations reaches 100.
2.4. Datasets
To evaluate the performance of the PICTGV method in photon-counting CT reconstruction, simulation and ex vivo data were used in experiments.
2.4.1. Simulated head data.
Clinical multi-energy CT images were acquired from a patient with a GE Discovery CT750 scanner. We adopted seven datasets with 40, 50, 60, 70, 80, 90, and 100 keV monochromatic images (gold standard). These images were obtained by the built-in software within the CT scanner. To generate photon-counting CT projections, the incident x-ray intensity of each energy bin were distributed according to the x-ray spectrum at 120 kV, as shown in Fig. 1, which was calculated using the TASMICS method [47]. Using the previously developed method [17], the projection data at seven energy bins were simulated with a fan-beam CT scanner using the monochromatic images obtained from the CT scanner. The geometry of the scanner is as follows: (1) the distance from the detector arrays to the x-ray source is 949 mm; (2) the distance from the rotation center to the detector arrays is 408 mm; (3) the number of detector elements is 888; and (4) the space of each detector bin is 1.0 mm. The image is composed of 512 × 512 square pixels with size of 0.5 mm × 0.5 mm. To demonstrate the performance of the PICTGV method in sparse-view reconstruction, 80-view projection were uniformly extracted from the full-view projection of each energy bin.
Fig. 1.
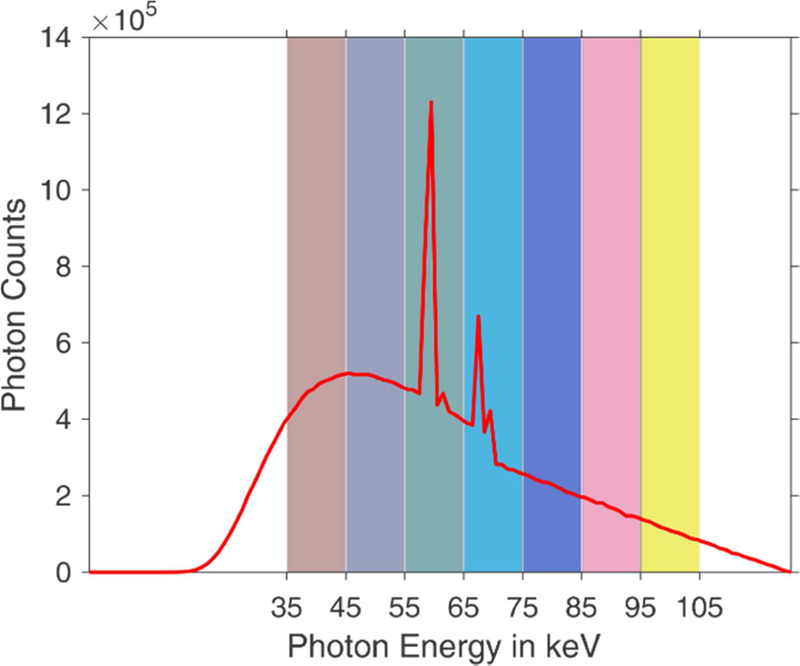
The 120 kV x-ray spectrum with narrow energy bins.
2.4.2. Digital circle phantom.
We also used a digital phantom to evaluate the PITGV method. The phantom (Fig. 2) contains 3 circular objects, which is made of different materials (Table 3). This phantom is of 512 × 512 array size, and the pixel size is 0.5 mm. The simulation was performed at 80 kV, and the corresponding spectrum (Fig. 3) was divided into six energy bins: [20, 30] keV, [30, 40] keV, [40, 50] keV, [50, 60] keV, [60, 70] keV, and [70, 80] keV. The geometry of the scanner is as follows: (1) the distance from the source to the detector is 1040 mm; (2) the distance from the rotation center to the detector arrays is 470 mm; (3) the number of detector elements is 672; and (4) the space of each detector bin is 1.407 mm. The image is composed of 512 × 512 square pixels with size of 0.5 mm. To demonstrate the performance of the PICTGV method in sparse-view reconstruction, 30-view projection were uniformly extracted from the full-view projection of each energy bin.
Fig. 2.
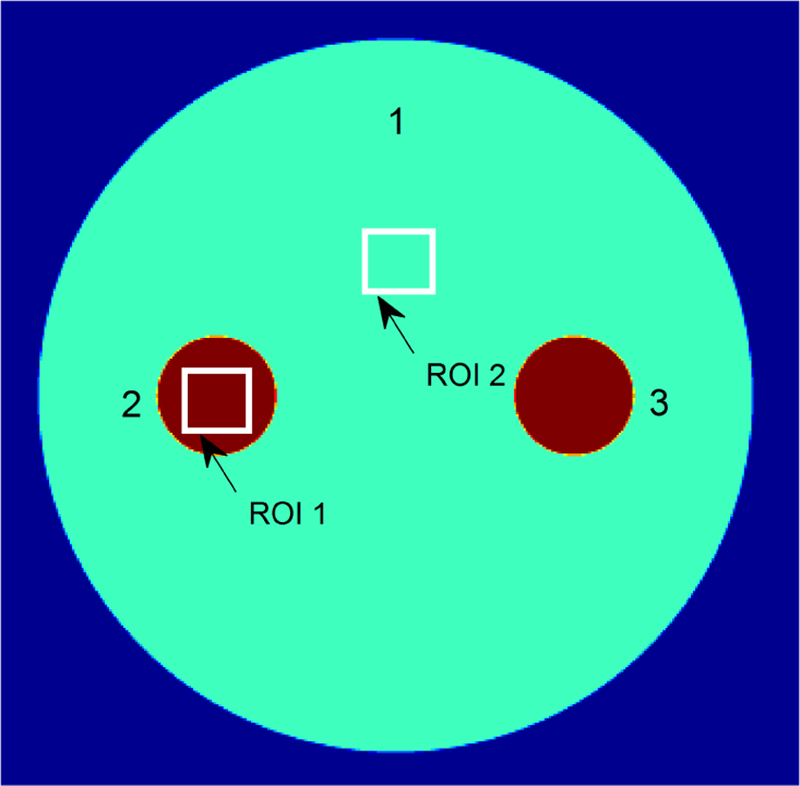
The digital circle phanotm with iodine contrast.
Table 3.
Parameters of the objects in the phantom (Fig. 2) and the associated materials
| Object | Center (mm) | Radius (mm) | Material |
|---|---|---|---|
| 1 | (0, 0) | 76.8 | Soft tissue |
| 2 | (−0.3, 0) | 12.8 | 0.2 % iodine + 99.8% water |
| 3 | (0.3, 0) | 12.8 | 0.2 % iodine + 99.8% water |
Fig. 3.
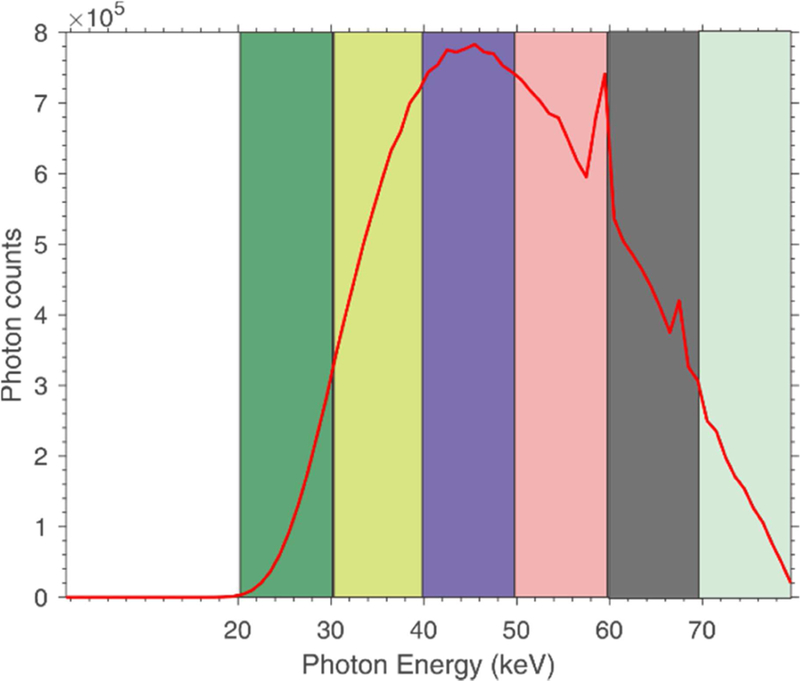
The 80 kV x-ray spectrum with six narrow energy bins.
2.4.3. Preclinical data.
Ex vivo data from a fresh lamb chop, including muscle, fat and bone regions was scanned by a MARS spectral CT. The MARS scanner is the latest Medipix3RX PCDbased small animal CT system. The distance from the x-ray source to the rotation center is 131.8 mm and the distance from the rotation center to detector arrays is 48 mm. The image is composed of 436 × 436 square pixels, and the size of each pixel is 0.09 mm. The x-ray tube voltage and current was set at 50 kVp and 120 µA, respectively. Four low energy thresholds (15, 20, 25, and 30 keV) were used. The projection in the first energy bin is acquired by counting all the photons whose energies are in the range of [15 keV, 20 keV]; the projection in the second energy bin is obtained by counting all the photons whose energies are in the range of [20 keV, 25 keV]; the projection in the third energy bin is acquired by counting all the photons whose energies are in the range of [25 keV, 30 keV]; the projection in the fourth energy bin is obtained by counting all the photons whose energies are in the range of [30 keV, 50 keV]. More details of this data can be 6 found in [48]. To demonstrate the performance of our method for sparse-view reconstruction, we 7 extracted a 163-view projection from the 651-view projection of each energy bin.
2.5. Performance evaluation
2.5.1. Image reconstruction accuracy.
We use the relative root mean square error (RRMSE) to 10 evaluate image reconstruction accuracy. The RRMSE is defined as follows:
| (13) |
where N is the total number of voxels in the image, µ(n) and µref ( n) represent the test value and the reference image at pixel n, respectively. A small RRMSE value indicates a small difference 14 between two images and vice versa.
2.5.2. Structural similarity metric.
The universal quality index (UQI) [49] is used to evaluate the 16 structural similarity between test and reference images. For the region of interest (ROI) in two 17 images, the mean, variance and covariance of the intensities in the ROI can be, respectively, 18 calculated as:
| (14) |
| (15) |
| (16) |
where µ(s) denotes the voxel value of the test image and µref (s) denotes the voxel value of the reference image in the ROI; S is the total number of voxels in the ROI. The UQI can be calculated as follows:
| (17) |
The UQI ranges from 0 to 1; a higher UQI suggests a better similarity between test and reference images.
2.5.3. Feature similarity index.
To further evaluate the performance of the PICTGV method, the 29 feature similarity (FSIM) index is used for image quality assessment [50]. The principle of FSIM 30 is that human visual system perceives an image using its phase congruency and gradient magnitude 31 features. The FSIM ranges from 0 to 1; a higher FSIM indicates a better similarity between 32 reconstructed and reference images.
2.5.4. Material decomposition.
The linear attenuation coefficient of each pixel in the reconstructed 2 image can be expressed as the linear combination of the values of the basis material [29, 51]. Using the value of the basis material, the material composition can be formulated as
| (18) |
where µH/L denotes the image at high (100 keV) or low (40 keV) energy bins, µij is the linear attenuation coefficient of basis material i (i = 1 or 2) at the energy bin j ( j =H or L ), and x1 and x2 represent the decomposed image. The material decomposition can be given by the following straightforward matrix inversion:
| (19) |
Thus, the material decomposition can be performed using Eq. (19) according to the basis material 11 and the reconstructed images at both high and low energy bins.
2.5.5. Comparison method.
The performance of the present PICTGV method was compared with 13 the PICCS method. The PICCS method for photon-counting CT reconstruction can be formulated 14 as follows:
| (20) |
where is a TV norm, and the prior image µp is reconstructed from the broad-spectrum projection data y , expressed as
| (21) |
3. Results
3.1. Simulated head data study
3.1.1. Selection of parameters.
Two parameters (λ and β ) can be set independently in the PICTGV and PICCS methods. The parameter λ determines the weight to be given to conformity 23 with the high-quality prior image. As indicated by a previous study [52], a value of λ near 0.5 is an optimal choice for PICCS method. For a fair comparison, we set λ= 0.5 for both PICCS and 25 PICTGV methods. The penalty parameter β is used to balance the data fidelity term and the prior constraints. The reconstructed images become blurred when the value of β is too large. Meantime, reconstructed images are too noisy and streaky when the value of β is too small. In this study, the parameter β was selected within a range of possible values. The RRMSE and UQI of the reconstructed image in a representative energy bin (70 keV) were presented for the two iterative 30 reconstruction methods in Figs. 4 and 5, respectively. For each curve, the parameter β with the minimal RRMSE and maximal UQI was used, that is, the parameter β in the PICTGV method was set at 8.0 10× −4 and was set at 5.0 10×−4 in the PICCS method.
Fig. 4.
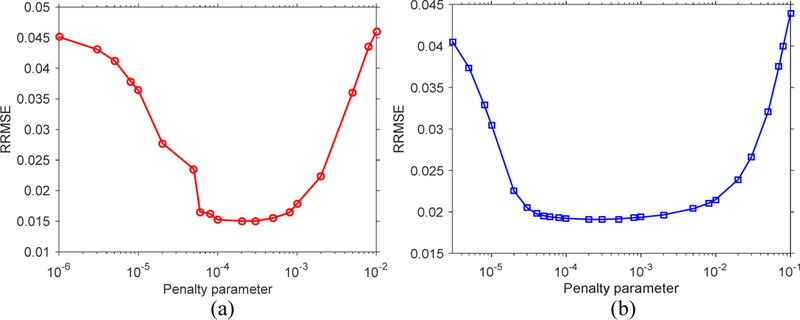
RRMSE of the reconstructed image with respect to penalty parameter β for two iterative reconstruction methods: (a) PICTGV; (b) PICCS.
Fig. 5.
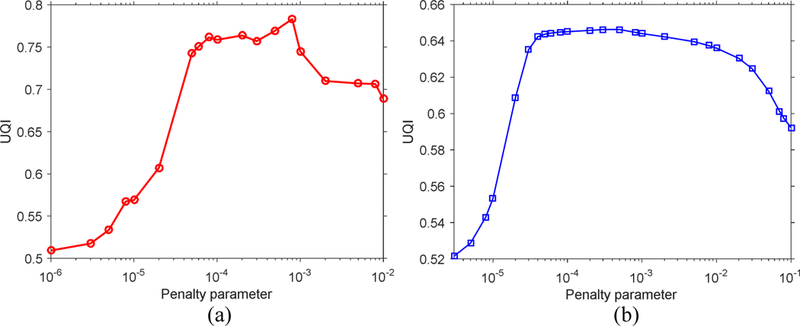
UQI of the reconstrued image with respcte to penalty parameter β for two iterative reconstruction methods: (a) PICTGV; (b) PICCS.
3.1.2. Convergence analysis.
Fig. 6 shows the curves of RRMSE and projection data fidelity error (defined as ) with respect to iterations for a representative energy bin (70 keV). These curves indicate that the proposed PICTGV method can converge after enough iterations steps when the RRMSE and projection data fidelity error do not decrease significantly.
Fig. 6.
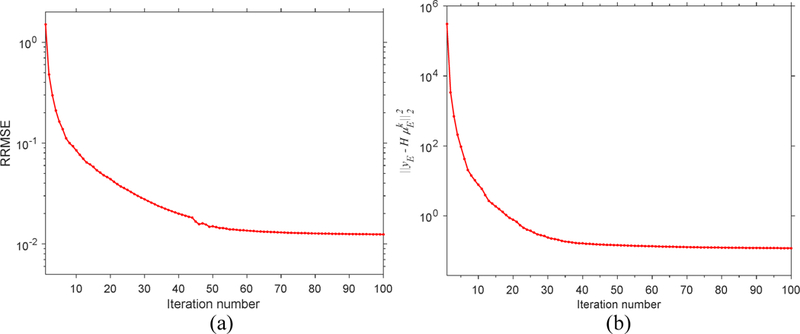
Convergence analysis for the PICTGV reconstruction: (a) the curve of RRMSE with respect to iterations; (b) the curve of projection data fidelity with respect to iterations.
3.1.3. Visual evaluation.
Results with 40, 70, and 100 keV energy bins are respectively shown in Figs. 7, 8, and 9. The gold standard are illustrated in Figs. 7(a)–9(a). The images reconstructed by the FBP algorithm from the 80-view projection are shown in Figs. 7(b)–9(b). Severe streak artifacts exist in the FBP results because of insufficient angular sampling. The images reconstructed by the PICCS method from the 80-view projection are shown in Figs. 7(c)–9(c). Although most of the streak artifacts were suppressed, undesired artifacts still exist in the PICCS images. The images reconstructed by the PICTGV method from the 80-view projection are displayed in Figs. 7(d)–9(d). The results show that PICTGV method can achieve more gains over PICCS in terms of noise reduction and artifacts suppression.
Fig. 7.
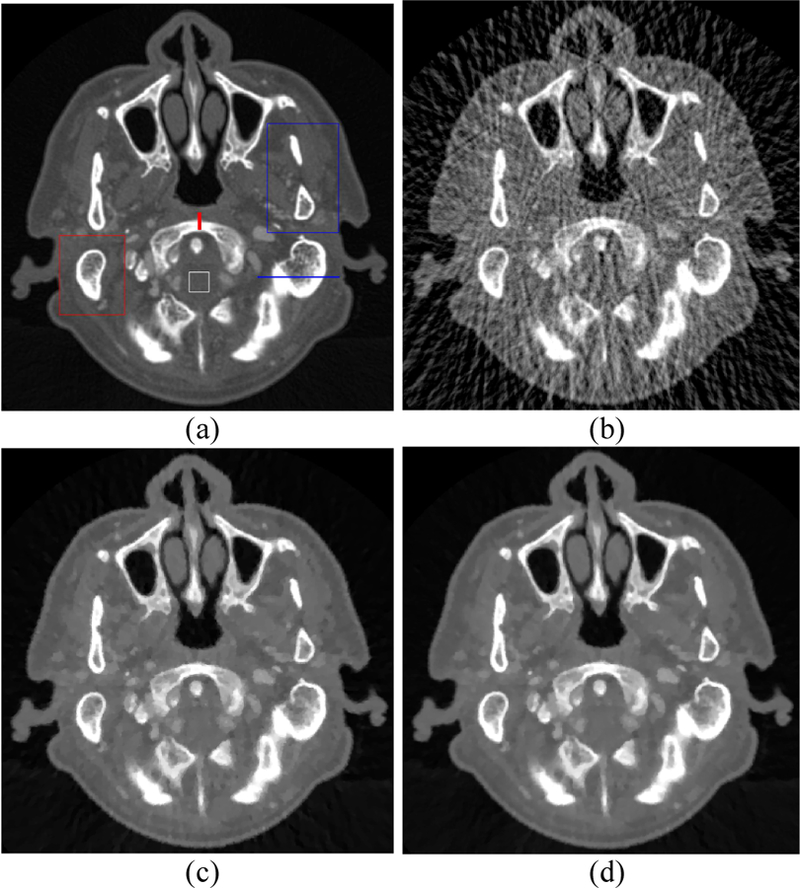
CT images with 40 keV energy bin: (a) Phantom (gold standard); (b) FBP; (c) PICCS; (d) PICTGV. Display window: [0.012, 0.06] mm-1.
Fig. 8.
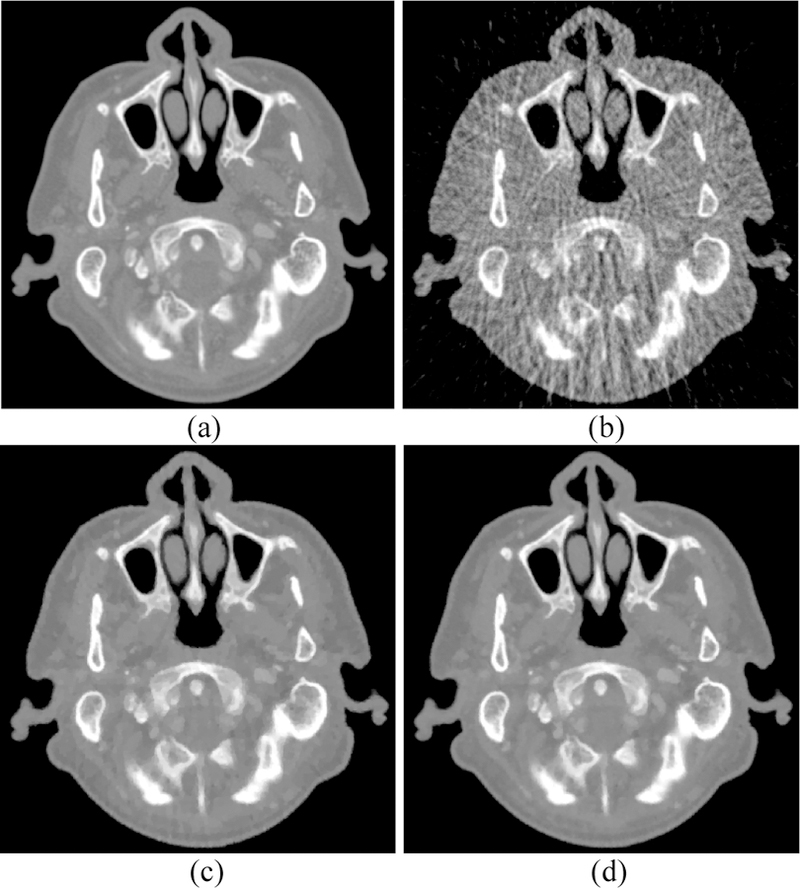
CT images with 70 keV energy bin: (a) Phantom (gold standard); (b) FBP; (c) PICCS; (d) PICTGV. Display window: [0.012, 0.031] mm-1.
Fig. 9.
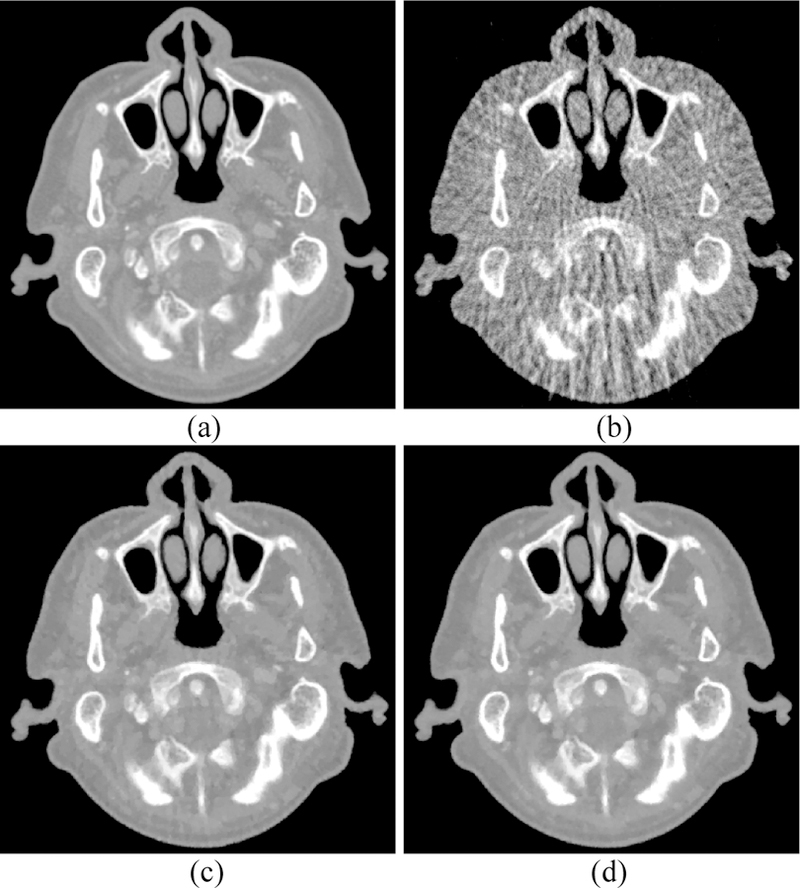
CT images with 100 keV energy bin: (a) Phantom (gold standard); (b) FBP; (c) PICCS; (d) PICTGV. Display window: [0.012, 0.023] mm-1.
To further visualize the differences between the PICCS and PICTGV results, horizontal profiles of the resulting images were drawn along the blue line as indicated Fig. 7(a). Profiles associated with the corresponding profile of the gold standard were given as reference (Fig. 10). It is clear that the PICTGV method achieves better matching results than the PICCS method.
Fig. 10.

Horizontal profiles of the images reconstructed by the PICCS and PICTGV methods form different energy 4 bins: (a) 40 keV; (b) 70 keV; (c) 100 keV.
3.1.4. UQI measures.
To further quantitatively evaluate the PICTGV method, we studied the UQI. The zoomed detail of two ROIs (as indicated by the red and blue squares in Fig. 7 (a)) of Figs. 7–9 are illustrated in Figs. 11 and 12, respectively. The PICCS method presented patchy artifacts, especially in the ROI indicated by the blue square. The curves of the UQI measures versus different energies are depicted in Fig. 13. The PICTGV results are higher than the PICCS results 10 for the two ROIs.
Fig. 11.
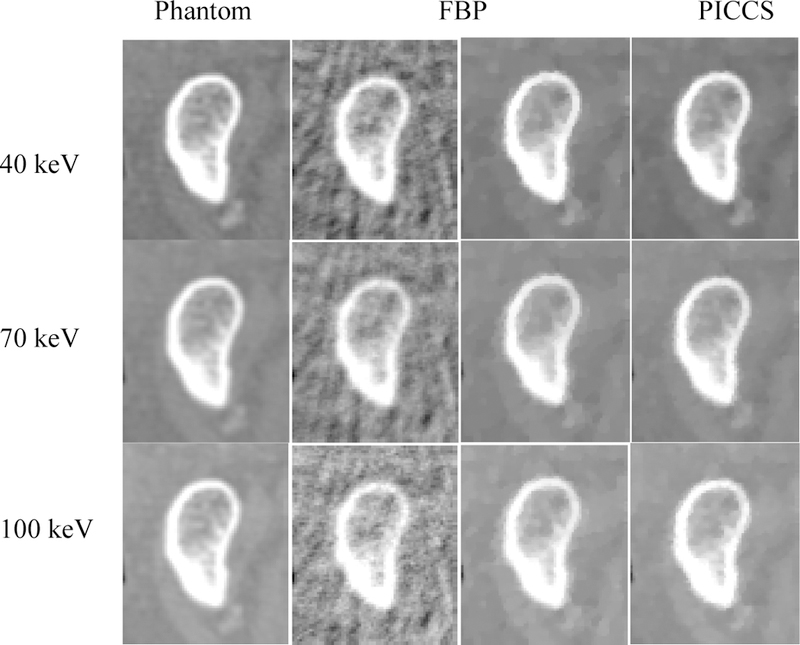
Zoomed detail of the ROI (indicated by the red square in Fig. 7(a)). From left to right, the results are Phantm 16 (gold standard), FBP, PICCS, and PICTGV, respectively.
Fig. 12.
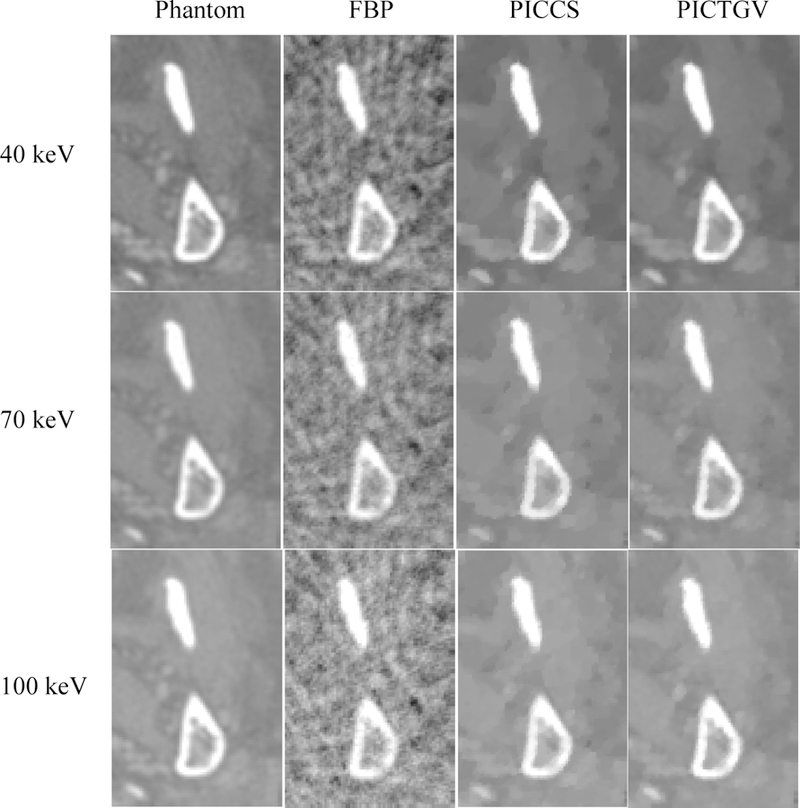
Zoomed detail of the ROI (indicated by the blue square in Fig. 7(a)). From left to right, the results are Phantom (gold standard), FBP, PICCS, and PICTGV, respectively.
Fig. 13.
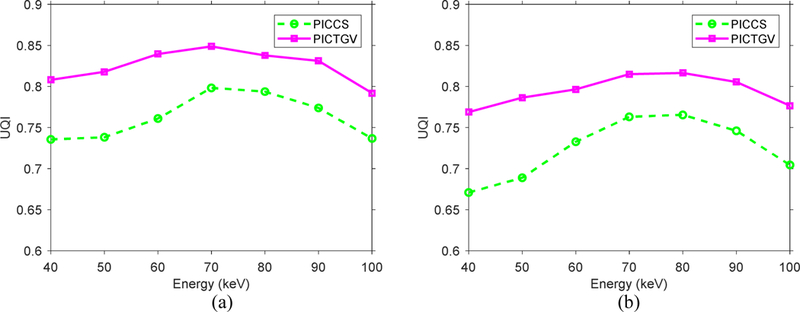
Curves of the UQI measures versus different energy bins from the PICCS and PICTGV methods: (a) ROI 10 indicated by the red square; (b) ROI indicated by the blue square.
3.1.5. Noise-resolution tradeoff.
The noise-resolution tradeoff is used to evaluate the resolution of 12 the reconstructed image. The resolution can be analyzed by the edge spread function (ESF) along 13 the profile as indicated by the red line in Fig. 7(a). Assume that the broadening kernel is a 14 Gaussian function with standard deviation (SD) δ , the ESF is described by an error function (EF) 15 parameterized by δ . The parameter δ can be obtained by fitting the profile to an EF. The parameter δ is determined by the full-width at half-maximum (FWHM) of the broadening Gaussian function, which reflects the resolution of the reconstructed image.
The noise of the reconstructed image was characterized by the SD of a uniform region of size 20 × 20 in the background region as indicated by the white square in Fig. 7(a). By varying the penalty parameter β for the PICTGV method, we obtained the noise-resolution tradeoff curve. The noise-resolution tradeoff curves of PICCS and PICTGV results with 40, 70 and 100 keV energy bins are shown in Fig. 14. At matched resolution, the PICTGV has a lower noise level than PICCS in both curves.
Fig. 14.

Noise-resolution tradeoff curves of PICCS and PICTGV methods from different energy bins: (a) 40 keV; (b) 11 70 keV; (c) 100 keV.
3.1.6. Material decomposition study.
The basis material images decomposed using gold standard, FBP, PICCS and PICTGV images are illustrated in Fig. 15 as follows: the results obtained with the gold standard images are displayed in Figs. 15(a) and (e); the results obtained using the FBP images are depicted in Figs. 15(b) and (f); the results obtained using the PICCS images are presented in Figs. 15(c) and (g); and the results obtained using PICTGV images are shown in Figs. 15(d) and (h). Severe noise can be observed in the FBP results. The noise in the PICCS results is greatly reduced as compared with the FBP results, aside from some structure and edge detail loss in the highly attenuated regions. The results obtained with the PICTGV images indicate similar results to those obtained using the gold standard. The zoomed details of the two ROIs in Fig. 15 are shown in Fig. 16. The results obtained with the PICTGV results yield better structure- and edge-preservation than those of the PICCS results, as indicated by the red arrows. The material decomposition images obtained with the PICTGV results yield higher UQI values than other results (Fig. 17).
Fig. 15.
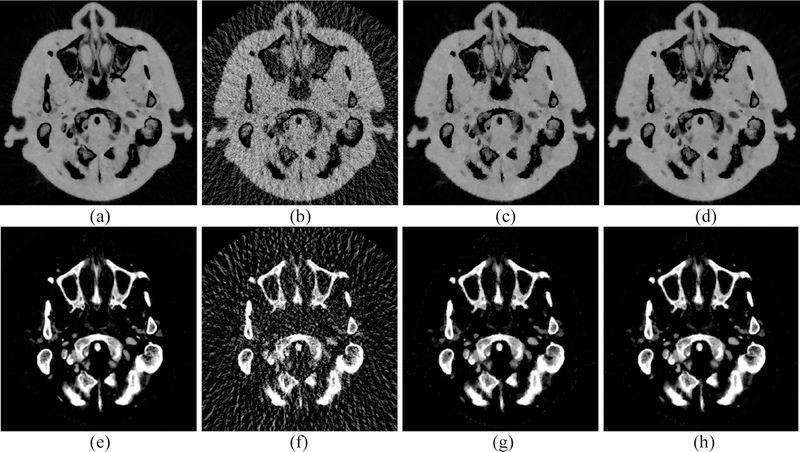
Material decomposition image from different results. Images (a) and (e) represent soft tissue and bone material images obtained with gold standard images. Images (b) and (f) represent soft tissue and bone material images obtained with FBP images. Images (c) and (g) represent soft tissue and bone material images obtained with PICCS images. Images (d) and (h) represent soft tissue and bone material images obtained with the PICTGV images. Display window: [0, 1].
Fig. 16.
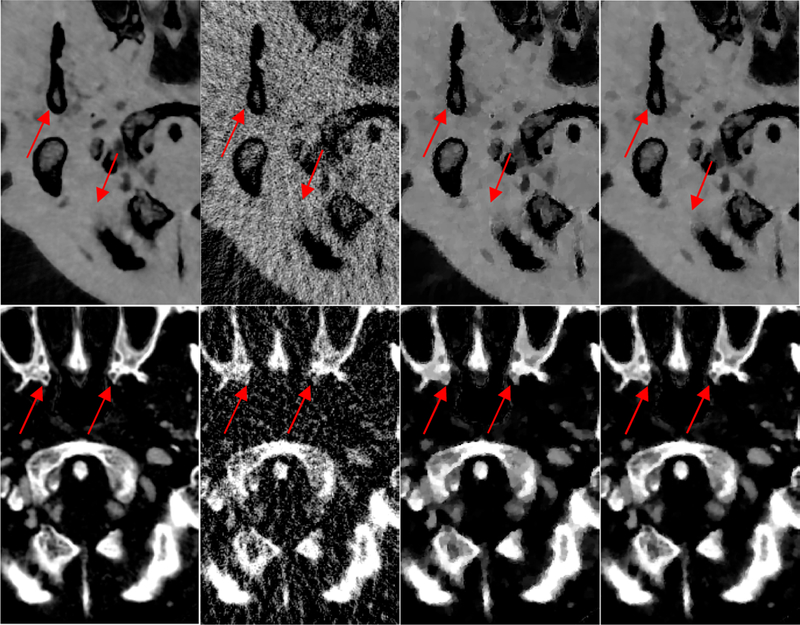
Zoom-in views of the two ROIs in Fig. 15. From left to right, the results refer to the gold standard, FBP, PICCS, and PICTGV, respectively.
Fig. 17.
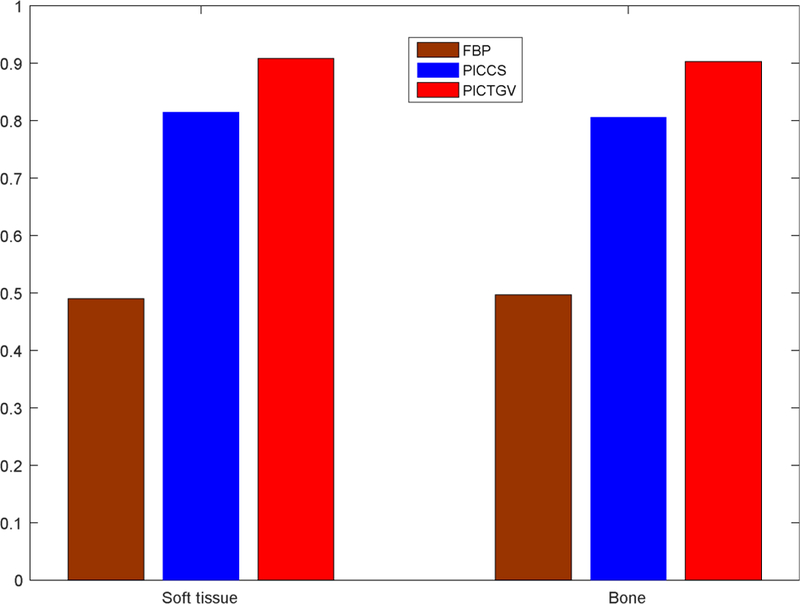
UQI measures of the zoomed details in Fig. 16.
3.2. Digital circle phantom study
3.2.1. Visual evaluation.
Figure 18 shows images of the digital circle phantom, with rows 1–2 showing images at 25 and 55 keV energy bins, respectively. The first column displays the digital circle phantom images. The second column depicts the images reconstructed by the FBP algorithm. The third column depicts the images reconstructed by the PICCS method. The fourth column illustrates the images reconstructed by the PICTGV method. Severe streak artifacts can be observed in the FBP results. The artifacts is mostly reduced in PICCS results, however, the edges become over-smoothed. The PICTGV method achieves the best performance compared with FBP and PICCS methods in terms of noise reduction and artifacts suppression.
Fig. 18.
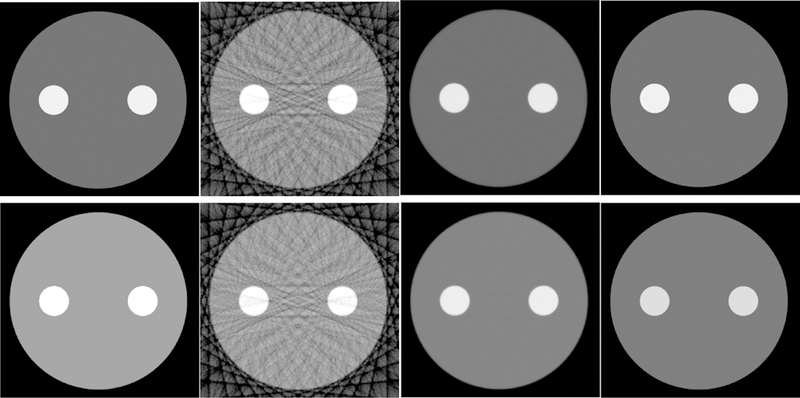
Digital phantom results. From lefft to righ, the images correspond to phantom, FBP algorihtm, PICCS method, and PICTGV method. The first row is the results at 35 keV energy bin, and the display window is [0, 0.1] mm−1; the second row is the results at 55 keV energy bin, and the display window is [0, 0.06] mm-1.
3.2.2. FSIM study.
To further quantitatively evaluate the PICCS and PICTGV methods, we studied the FSIM of the reconstructed results. The curves of the FSIM measures versus different energies are depicted in Fig. 19. The value of FSIM is closer to 1.0, the image quality of reconstructed result is better. From Fig. 19, the PICTGV method has larger FSIM value than PICCS method.
Fig. 19.
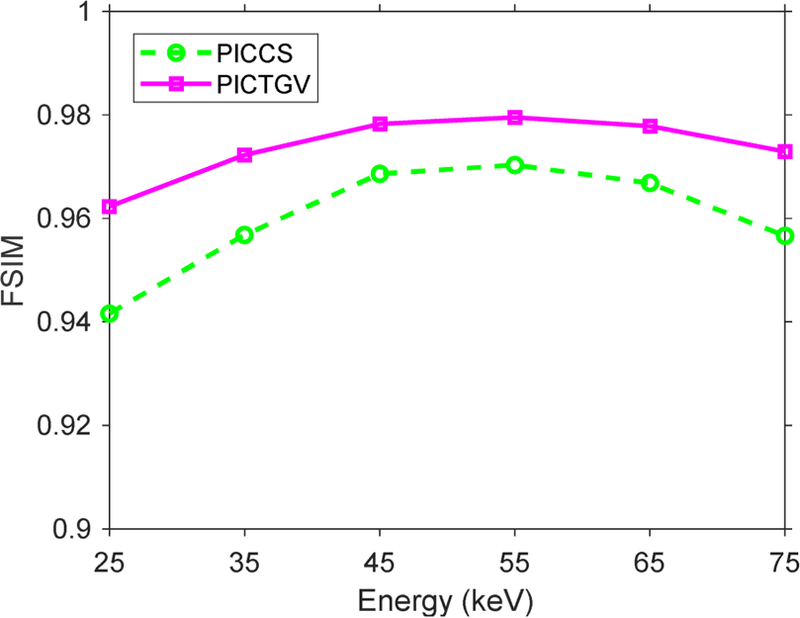
FSIM assessment for the reconstructed PICCS and PICTGV results.
3.2.3. Material decomposition.
The basis material images decomposed using phantom, FBP, PICCS and PICTGV images are shown in Fig. 20. We can observe that the results obtained from FBP images have severe noise and artifacts. The noise and artifacts in the results obtained from PICCS images is effectively suppressed, however, some undesired noise still exists in the soft tissue images. The results obtained from the PICTGV results achieve more gains over the PICCS method in terms of noise reduction and artifacts suppression. Moreover, the results obtained from PICTGV results has the highest FSIM values than other results (Fig. 21).
Fig. 20.
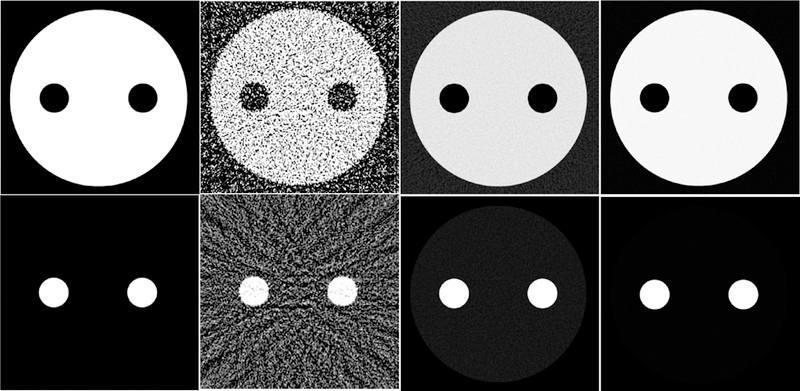
Material decomposition results. From lefft to righ, the results correspond to phantom, FBP algorihtm, PICCS method, and PICTGV method. The first row is the soft tissue images; the second row is the iodine imags. The display window is [0, 1].
Fig. 21.
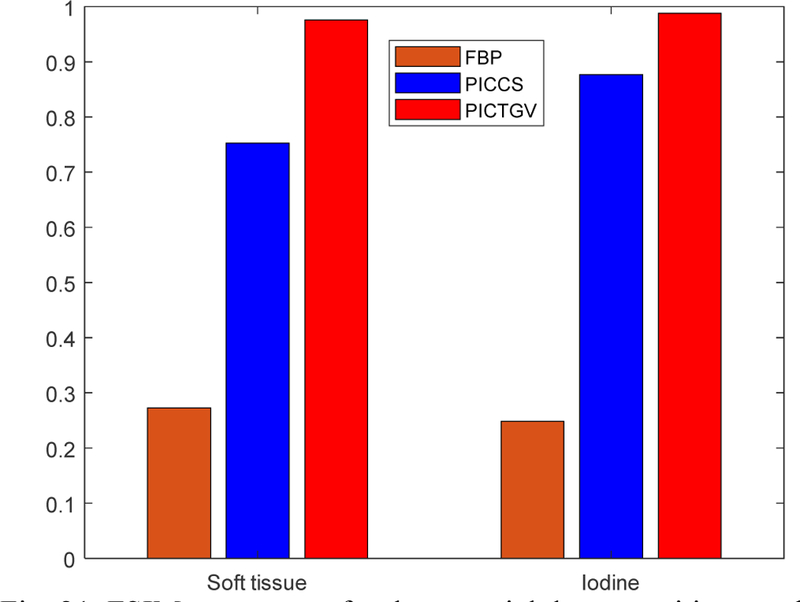
FSIM assessment for the material decomposition results.
3.3. Preclinical data study
A slice of the fresh lamb chop reconstructed from a real photon-counting CT is depicted in Fig. 22. The first row is the results at 20 keV and the second row is the results at 25 keV. The results reconstructed by the FBP algorithm from the 163-view projection are represented in Figs. 22(a) and (e). The results reconstructed by the FBP algorithm from the full-view projection are shown in Figs. 22(b) and (f). High levels of noise can be observed in both FBP results. The results reconstructed by the PICCS method from the 163-view projection are represented in Figs. 22(c) and (g). The PICCS method can efficiently suppress noise and artifacts, however, the patchy artifacts can still be observed in the results. These undesired effects have resulted from the piecewise constant assumption of TV regularization. The results reconstructed by the PICTGV method from the 163-view projection are illustrated in Figs. 22(d) and (h). We observed that the noise and patchy artifacts were effectively suppressed in PICTGV results. The performance of the PICCS and PICTGV methods with the zoomed details of ROI are shown in Fig. 23. Our results show that the PICTGV method achieves better noise reduction and artifacts suppression than the PICCS method.
Fig. 22.
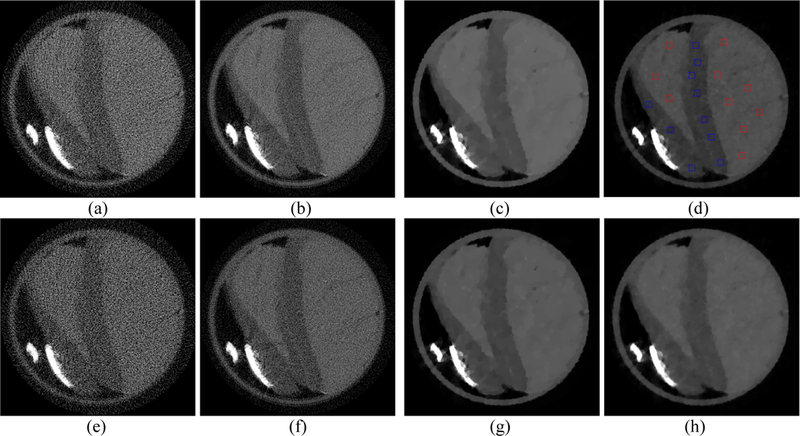
PCD-based spectral CT images at 20 keV (first row) and 25 keV (second row). Figures (a) and (e) represent the results reconstrued by FBP method from the 163-view projeciton. Figures (b) and (f) represent the results reconstructed by FBP method from the full-view projection. Figures (c) and (g) represent the results reconstructed by PICCS method from the 163-view projection. Figures (d) and (h) represent the results reconstructed by PICTGV method from the 163-view projection. Display window (first row): [0, 0.12] mm-1.
Fig. 23.
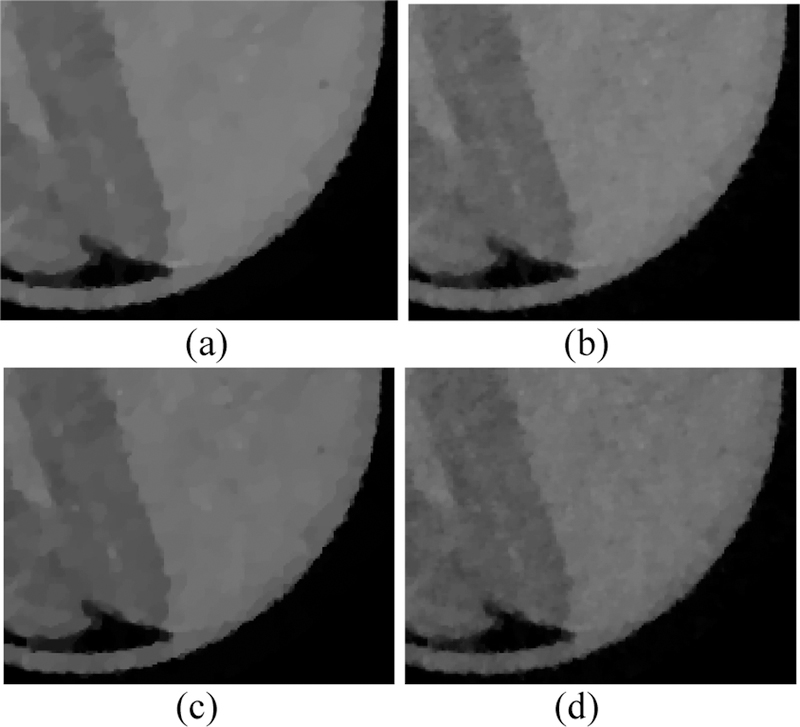
The zoomed ROIs of PICCS and PICTGV results at 20 keV (first row) and 25 keV (second row). Figures (a) and (c) are the PICCS results. Figures (b) and (d) are the PICTGV results.
To quantitatively evaluate the performance of the PICCS and PICTGV methods, we selected 10 ROIs (indicated by the squares in Fig. 22 (d)) in the meat and fat areas to calculate the CNR (contrast-to-noise ratio) and SNR (signal-to-noise ratio) of the reconstructed images. The SNR and CNR are calculated as follows:
| (22) |
| (23) |
where is the average standard deviation of meat ROIs, and and are the mean value of the meat and fat ROIs, respectively. The averaged CNR and SNR values of four energy bins for PICCS and PICTGV results are shown in Fig. 24. It can be observed that both CNR and SNR of the PICTGV results are higher than that of the PICCS results.
Fig. 24.
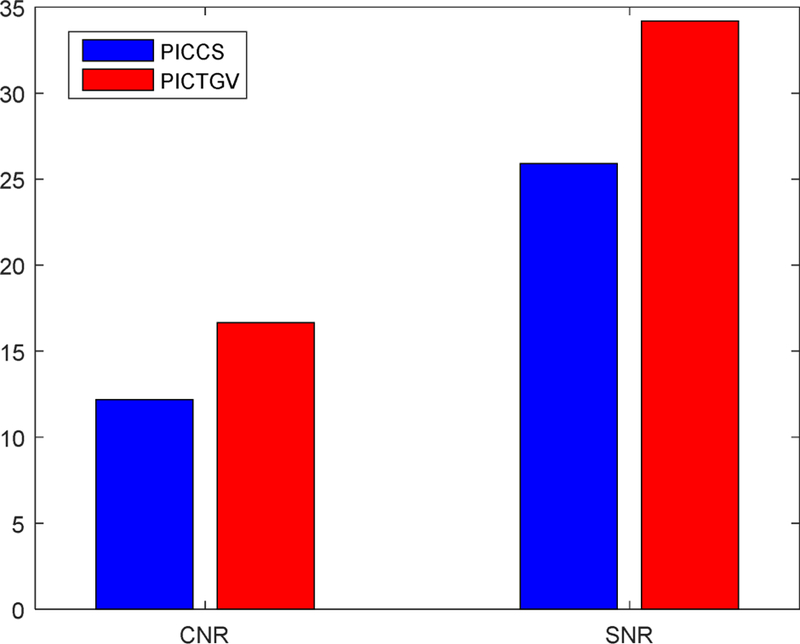
CNR and SNR of the images reconstructed by PICCS and PICTGV methods.
4. Discussion and conclusion
We have presented a PICTGV method for noise suppression in photon-counting CT imaging with narrow energy bins. The proposed method is formulated as an optimization problem that balances data fidelity and PICTGV regularization of the target image into one framework. In contrast to PICCS method, PICTGV uses higher-order derivatives of the target image. The use of TVG regularization can effectively eliminate the patchy artifacts, which is often observed in the TVbased method. In addition, structure correlations between each energy bin image and high-quality image were incorporated into the photon-counting CT reconstruction. Results from simulation and experimental studies show that the presented PICTGV method outperforms the existing PICCS method based on different measurement metrics.
The photon-counting CT dataset was simulated from monochromatic images acquired on a GE Discovery CT 750 HD scanner. Although this projection dataset was not obtained from the real PCD, it can still be used to evaluate photon-counting CT reconstruction. The accuracy and resolution properties of the PICTGV method were extensively validated and evaluated in results section. The PICTGV method yields better structure preservation and patchy artifacts suppression than the PICCS method. Quantitative tests were also used to evaluate the difference between the PICTGV and PICCS results. The noise-resolution tradeoff and UQI studies indicate a superiority of the PICTGV method over the PICCS method in terms of structure and resolution preservation. We further validated the PICTGV method using real PCD data from MARS spectral CT scanner [48]. The results indicate that the PICTGV method achieves better noise reduction and patchy artifacts suppression than the PICCS method.
Determining the optimal penalty parameter for comparison is always challenging in CT image reconstruction [53, 54], as discussed in many iterative reconstruction methods. In the PICTGV method, we need to determine the value of parameters λ and β. Because parameter β is related to the smoothness of the target image, a large value will often lead to an oversmoothed result. Thus, we can assign a large value to β and gradually decrease it until we can obtain a satisfied result. For another parameter, we only focus on the value of λ= 0.5 . Furthermore, we illustrate the impact of prior image parameter λ on PICTGV image quality with fixed value of β. The RRMSE and UQI curves corresponding to different λ values in a representative energy bin (70 keV) of the simulated data were plotted in Fig. 25. It is clear that the RRMSE and UQI curves achieved a minimum and maximum value, respectively, when λ is 0.5 . Thus, a λ value of 0.5 is optimal for PICTGV reconstruction in terms of RRMSE and UQI metrics, which is consistent with the PICCS method. The parameter of λ and βwere chosen empirically based on visual inspection and quantitative evaluations. For the PICTGV method, exploring an automatic approach for the parameters selection will be an interesting topic in a future study. Nevertheless, once the parameters are optimized for a certain anatomic site, they can be applied to other patients of the similar size.
Fig. 25.
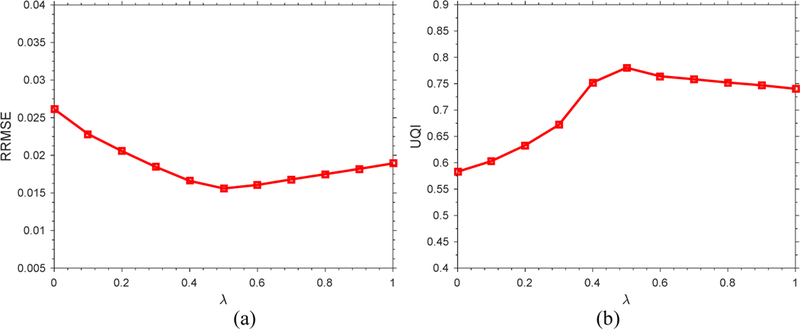
The quantitative metrics of reconstructed images with respect to parameter λ. (a) RRMSE measures; (b) UQI measures.
To evaluate the influence of the prior image on the performance of PICTGV method, images reconstructed by TV, TGV, PICCS and PICTGV method in the 70 keV energy bin are shown in Fig. 26. The image reconstructed by the TV method exhibits patchy artifacts, which resulting from the piecewise constant assumption for the TV regularization. The patchy artifacts have been effectively suppressed in the images reconstructed by TGV and PICCS methods, however, some streak artifacts still exists as indicated by the red arrows in Figs. 26 (b) and (c). The RRMSE of the image reconstructed TV, TGV, PICCS and PICTGV methods are 3.02%, 2.63%, 2.51%, and 1.51%, respectively. The UQI of the image reconstructed TV, TGV, PICCS and PICTGV methods are 0.55, 0.58, 0.62, and 0.73, respectively. These results demonstrate that the PICTGV methods achieves the best performance compared with competing methods.
Fig. 26.
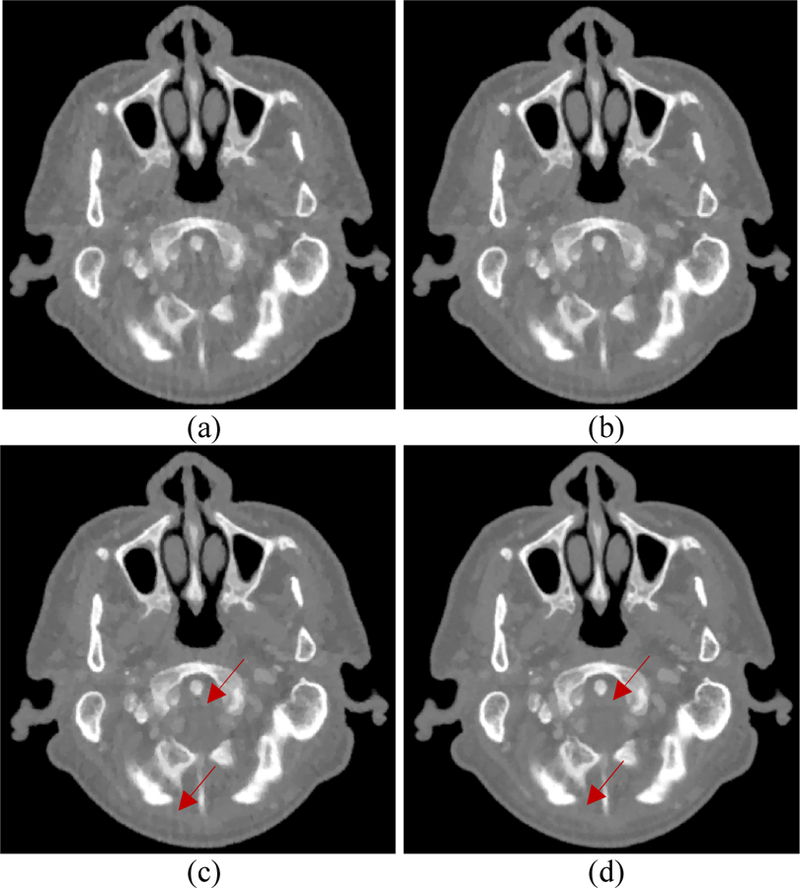
Influence of the prior image on the TV- and TGV-based methods. (a) image reconsturcted by TV method; (b) image reconstucted by TGV method; (c) image reconstructed by PICCS method; (d) image reconstructed by PICTGV method.
To further validate and evaluate the performance of the PICTGV method, the adaptive space angle (AdSA) method described by Wang et al. [26] was adopted for comparison. The digital phantom images at 45 keV energy bin are shown in Fig. 27. The phantom image is shown in Fig. 27(a). The FBP result reconstructed from 30 projection views is depicted in Fig. 27(b). The AdSA result reconstructed from 30 projection views is illustrated in Fig. 27(c). The PICTGV result reconstructed from 30 projection views is displayed in Fig. 27(d). It can be observed that the image quality of FBP image is seriously degraded because of insufficient sampling and few available photons in the corresponding energy bin. The streak artifacts and noise have been effectively reduced in AdSA result, however, some patchy artifacts can be observed around the iodine objects. The RRMSE of the image reconstructed AdSA and PICTGV methods are 3.93%, and 1.96%, respectively. The UQI of the image reconstructed AdSA and PICTGV methods are 0.86 and 0.95, respectively. We confirmed that PICTGV method achieves the best performance in terms of noise reduction and patchy artifacts suppression.
Fig. 27.
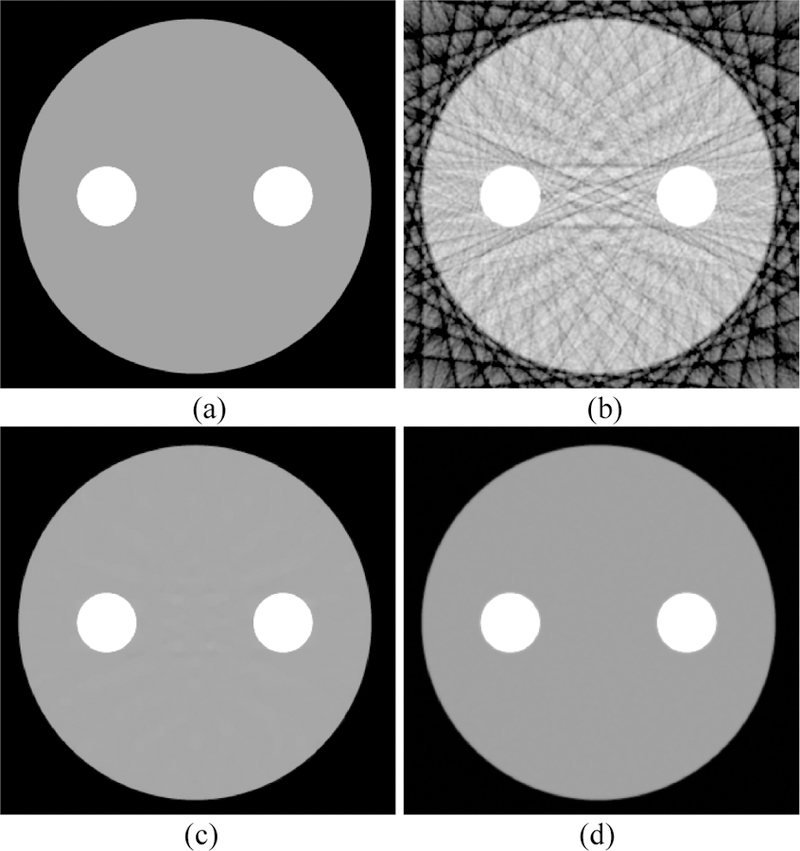
Digital phantom images at 45 keV energy bin. (a) Phanotm; (b) image reconstructed by FBP algorithm; (c) image reconstructed by AdSA method; (d) image reconstructed by PICTGV method.
It is noted that the prior image used in our work is the total image reconstructed from detected photons of all energy bins. While a target image µE will not be too different from the prior image µp with such a choice, there are still a scaling factor m (µp =mµE ) between the target image and prior image. For example, for the digital phantom, the scaling factor of two different ROIs for energy bins 1–6 are shown in Fig. 28. One could incorporate an average scaling factor m of ROIs into the penalty design by introducing . With the reduced difference between and µp , we expected that the performance of the PICTGV could be further improved.
Fig. 28.
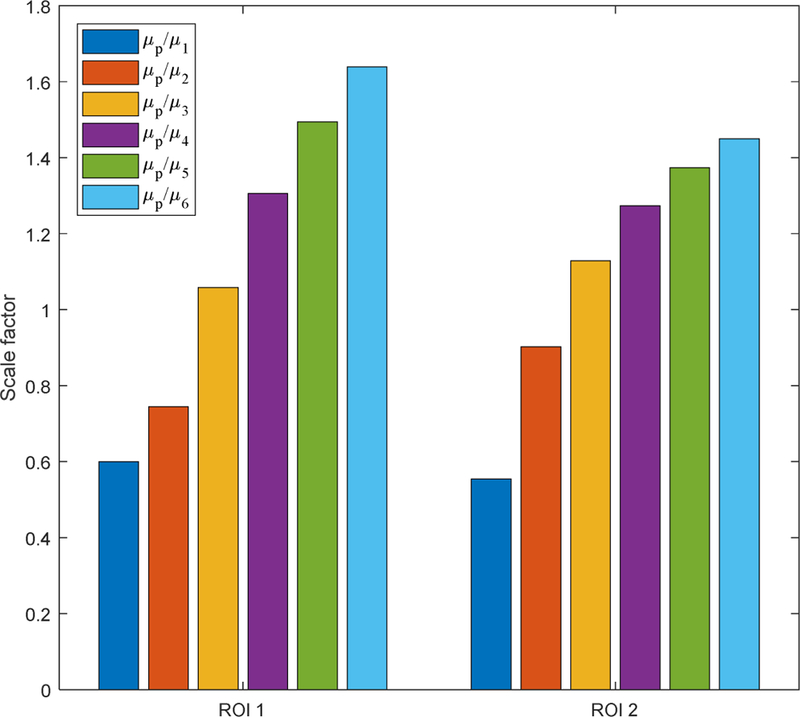
The scale factor between the target image and prior image for digital phantom.
Although iterative reconstruction has shown great advantages in noise suppression and resolution preservation, the PICTGV method still has some potential limitations in its current form. First, the computational time is still a challenge for practical use of PICTGV method. The computational time for the PICTGV method is longer than that of the PICCS method because of the extra time needed for second order derivation calculation. It takes about 1.2 and 0.9 s to finish one iteration to reconstruct the image of a size 512 × 512 using a PC with 3.3 GHz CPU for PICTGV and PICCS methods, respectively. A parallel implementation of the PICTGV method on a graphics processing unit (GPU) can dramatically decrease the computational time [55]. Second, the back and forward projection operators and the TGV regularization are all in 2D, and thus PICTGV method is for 2D images. The performance of PICTGV method for cone beam photoncounting CT reconstruction is under construction. Third, the material decomposition was directly performed via a numerical matrix inversion. However, this decomposition does not fully exploit the prior information of basis material image, possibly reducing signal magnitude and introducing unwanted oscillations [51]. This shortcoming has led to studies that incorporates prior information to stabilize material decomposition [51, 56–58]. Enforcing regularization/prior on the material decomposition may be an interesting research future topic to yield more evident advantages. Thirdly, the evaluation studies are mainly based on phantom simulations. Although the PICTGV method was tested on experimental data of a lamp chop in this preliminary work, patient studies using photon-counting CT are highly desired to evaluate the performance of PICGTV for clinically relevant tasks.
Acknowledgments
This work was supported in part by the Cancer Prevention and Research Institute of Texas (RP160661), US National Institutes of Health (R01 EB020366), National Natural Science Foundation of China (11701097, 11661007), Natural Science Foundation of Jiangxi Province (20181BAB201007, 20161BAB212055). The authors would like to thank Dr. Damiana Chiavolini for editing the manuscript.
Footnotes
Publisher's Disclaimer: This is a PDF file of an unedited manuscript that has been accepted for publication. As a service to our customers we are providing this early version of the manuscript. The manuscript will undergo copyediting, typesetting, and review of the resulting proof before it is published in its final citable form. Please note that during the production process errors may be discovered which could affect the content, and all legal disclaimers that apply to the journal pertain.
Shanzhou Niu received his Ph.D. degree in biomedical engineering from Southern Medical University in 2015. Then he joined the School of Mathematics and Computer Science at the Gannan Normal University. He is currently a postdoctoral researcher in the Department of Radiation Oncology at UT Southwestern Medical Center. His research interests include CT imaging, image processing, and optimization theory and methods.
You Zhang received his Ph.D. degree in biomedical engineering from Duke University in 2015. He is currently an assistant professor in the Department of Radiation Oncology at the UT Southwestern Medical Center. His research interests include CT/CBCT reconstruction and image registration.
Yuncheng Zhong is currently an instructor in the Department of Radiation Oncology at the UT Southwestern Medical Center. His research interests include CT and PET imaging.
Guoliang liu is currently an associated professor in the School of Information Engineering at the Gannan Medical Unviersity. His research interest is CT imaging.
Shaohui Lu is currently an associated professor in the First Affiliated Hospital of Gannan Medical University. His research interesting is perfusion CT imaging.
Xile Zhang is currently a physicist in the Department of Radiation Oncology at Peking University Third Hospital. His research interest is CT imaging.
Tinghua Wang is currently an associate professor in the School of Mathematics and Computer Science at Gannan Normal University. His research interests include machine learning and image processing.
Shengzhou Hu is currently is currently an associate professor in the School of Mathematics and Computer Science at Gannan Normal University. His research interests include machine learning and image processing.
Gaohang Yu received his Ph.D. degree in computational mathematics from Sun Yat-Sen University in 2007. He is currently a professor in the School of Science at Hangzhou Dianzi University. His research interests include optimization theory and methods, and image processing.
Jing Wang received his Ph.D. degree in physics from the State University of New York at StonyBrook in 2006. He is currently an associate professor in the department of Radiation Oncology at the UT Southwestern Medical Center. His research interests include tomographic image reconstruction, medical image processing and image-guided radiation therapy
References
- 1.Alvarez RE and Macovski A, Energy-selective reconstructions in X-ray computerized tomography. Phys Med Biol, 1976. 21(5): p. 733–44. [DOI] [PubMed] [Google Scholar]
- 2.Taguchi K and Iwanczyk JS, Vision 20/20: Single photon counting x-ray detectors in medical imaging. Med Phys, 2013. 40(10): p. 100901. [DOI] [PMC free article] [PubMed] [Google Scholar]
- 3.Shikhaliev PM, Beam hardening artefacts in computed tomography with photon counting, charge integrating and energy weighting detectors: a simulation study. Phys Med Biol, 2005. 50(24): p. 5813–27. [DOI] [PubMed] [Google Scholar]
- 4.Alvarez RE, Seibert JA, and Thompson SK, Comparison of dual energy detector system performance. Med Phys, 2004. 31(3): p. 556–65. [DOI] [PubMed] [Google Scholar]
- 5.Zhang H, et al. , Iterative reconstruction for dual energy CT with an average image-induced nonlocal means regularization. Phys Med Biol, 2017. 62(13): p. 5556–5574. [DOI] [PMC free article] [PubMed] [Google Scholar]
- 6.Grajo JR, et al. , Dual energy CT in practice: Basic principles and applications. Appl Radiol, 2016. 45(7): p. 6–12. [Google Scholar]
- 7.McCollough CH, et al. , Dual- and Multi-Energy CT: Principles, Technical Approaches, and Clinical Applications. Radiology, 2015. 276(3): p. 637–53. [DOI] [PMC free article] [PubMed] [Google Scholar]
- 8.Zbijewski W, et al. , Dual-energy cone-beam CT with a flat-panel detector: effect of reconstruction algorithm on material classification. Med Phys, 2014. 41(2): p. 021908. [DOI] [PMC free article] [PubMed] [Google Scholar]
- 9.Graser A, et al. , Dual energy CT: preliminary observations and potential clinical applications in the abdomen. Eur Radiol, 2009. 19(1): p. 13–23. [DOI] [PubMed] [Google Scholar]
- 10.Primak AN, et al. , Noninvasive differentiation of uric acid versus non-uric acid kidney stones using dualenergy CT. Acad Radiol, 2007. 14(12): p. 1441–7. [DOI] [PMC free article] [PubMed] [Google Scholar]
- 11.Shikhaliev PM, Computed tomography with energy-resolved detection: a feasibility study. Phys Med Biol, 2008. 53(5): p. 1475–95. [DOI] [PubMed] [Google Scholar]
- 12.Shikhaliev PM, Energy-resolved computed tomography: first experimental results. Phys Med Biol, 2008. 53(20): p. 5595–613. [DOI] [PubMed] [Google Scholar]
- 13.Shikhaliev PM and Fritz SG, Photon counting spectral CT versus conventional CT: comparative evaluation for breast imaging application. Phys Med Biol, 2011. 56(7): p. 1905–30. [DOI] [PubMed] [Google Scholar]
- 14.Leng S, et al. , Noise reduction in spectral CT: reducing dose and breaking the trade-off between image noise and energy bin selection. Med Phys, 2011. 38(9): p. 4946–57. [DOI] [PubMed] [Google Scholar]
- 15.Yu Z, et al. , Spectral prior image constrained compressed sensing (spectral PICCS) for photon-counting computed tomography. Phys Med Biol, 2016. 61(18): p. 6707–6732. [DOI] [PMC free article] [PubMed] [Google Scholar]
- 16.Zeng D, et al. , Spectral CT Image Restoration via an Average Image-induced Nonlocal Means Filter. IEEE Trans Biomed Eng, 2015. 63(5): p. 1044–57. [DOI] [PubMed] [Google Scholar]
- 17.Zeng D, et al. , Penalized weighted least-squares approach for multienergy computed tomography image reconstruction via structure tensor total variation regularization. Comput Med Imaging Graph, 2016. 53: p. 19–29. [DOI] [PubMed] [Google Scholar]
- 18.Xi Y, et al. , United iterative reconstruction for spectral computed tomography. IEEE Trans Med Imaging, 2015. 34(3): p. 769–78. [DOI] [PubMed] [Google Scholar]
- 19.Zhang Y, et al. , Spectral CT Reconstruction With Image Sparsity and Spectral Mean. Ieee Transactions on Computational Imaging, 2016. 2(4): p. 510–523. [DOI] [PMC free article] [PubMed] [Google Scholar]
- 20.Niu S, et al. , Nonlocal low-rank and sparse matrix decomposition for spectral CT reconstruction. Inverse Problems, 2018. 34(2): p. 024003. [DOI] [PMC free article] [PubMed] [Google Scholar]
- 21.Niu S, et al. , WE-FG-207B-05: Iterative Reconstruction Via Prior Image Constrained Total Generalized Variation for Spectral CT. Medical Physics, 2016. 43(6): p. 3835–3835. [Google Scholar]
- 22.Elbakri IA and Fessler JA, Statistical image reconstruction for polyenergetic X-ray computed tomography. IEEE Trans Med Imaging, 2002. 21(2): p. 89–99. [DOI] [PubMed] [Google Scholar]
- 23.Sawatzky A, et al. , Proximal ADMM for multi-channel image reconstruction in spectral X-ray CT. IEEE Trans Med Imaging, 2014. 33(8): p. 1657–68. [DOI] [PubMed] [Google Scholar]
- 24.Kim K, et al. , Sparse-view spectral CT reconstruction using spectral patch-based low-rank penalty. IEEE Trans Med Imaging, 2015. 34(3): p. 748–60. [DOI] [PubMed] [Google Scholar]
- 25.Zhang Y, et al. , Tensor-Based Dictionary Learning for Spectral CT Reconstruction. IEEE Trans Med Imaging, 2017. 36(1): p. 142–154. [DOI] [PMC free article] [PubMed] [Google Scholar]
- 26.Wang M, et al. , An adaptive reconstruction algorithm for spectral CT regularized by a reference image. Phys Med Biol, 2016. 61(24): p. 8699–8719. [DOI] [PMC free article] [PubMed] [Google Scholar]
- 27.Li S, et al. , An Efficient Iterative Cerebral Perfusion CT Reconstruction via Low-Rank Tensor Decomposition with Spatial-Temporal Total Variation Regularization. IEEE Transactions on Medical Imaging, 2018: p. 1–1. [DOI] [PubMed]
- 28.Chen GH, Tang J, and Leng S, Prior image constrained compressed sensing (PICCS): a method to accurately reconstruct dynamic CT images from highly undersampled projection data sets. Med Phys, 2008. 35(2): p. 660–3. [DOI] [PMC free article] [PubMed] [Google Scholar]
- 29.Szczykutowicz TP and Chen GH, Dual energy CT using slow kVp switching acquisition and prior image constrained compressed sensing. Phys Med Biol, 2010. 55(21): p. 6411–29. [DOI] [PubMed] [Google Scholar]
- 30.Zhang Y, et al. , A new CT reconstruction technique using adaptive deformation recovery and intensity correction (ADRIC). Med Phys, 2017. 44(6): p. 2223–2241. [DOI] [PMC free article] [PubMed] [Google Scholar]
- 31.Zhang Y, Tehrani JN, and Wang J, A Biomechanical Modeling Guided CBCT Estimation Technique. IEEE Trans Med Imaging, 2017. 36(2): p. 641–652. [DOI] [PMC free article] [PubMed] [Google Scholar]
- 32.Niu S, et al. , Iterative reconstruction for sparse-view x-ray CT using alpha-divergence constrained total generalized variation minimization. J Xray Sci Technol, 2017. 25(4): p. 673–688. [DOI] [PubMed] [Google Scholar]
- 33.Huang J, et al. , Sparse angular CT reconstruction using non-local means based iterative-correction POCS. Comput Biol Med, 2011. 41(4): p. 195–205. [DOI] [PubMed] [Google Scholar]
- 34.Sidky EY and Pan X, Image reconstruction in circular cone-beam computed tomography by constrained, total-variation minimization. Phys Med Biol, 2008. 53(17): p. 4777–807. [DOI] [PMC free article] [PubMed] [Google Scholar]
- 35.Rigie DS and La Riviere PJ, Joint reconstruction of multi-channel, spectral CT data via constrained total nuclear variation minimization. Phys Med Biol, 2015. 60(5): p. 1741–62. [DOI] [PMC free article] [PubMed] [Google Scholar]
- 36.Gao H, et al. , Multi-energy CT based on a prior rank, intensity and sparsity model (PRISM). Inverse Probl, 2011. 27(11): p. 115012. [DOI] [PMC free article] [PubMed] [Google Scholar]
- 37.Xu Q, et al. , Sparsity-regularized image reconstruction of decomposed K-edge data in spectral CT. Phys Med Biol, 2014. 59(10): p. N65–79. [DOI] [PMC free article] [PubMed] [Google Scholar]
- 38.Li L, et al. , A tensor PRISM algorithm for multi-energy CT reconstruction and comparative studies. J Xray Sci Technol, 2014. 22(2): p. 147–63. [DOI] [PubMed] [Google Scholar]
- 39.Liu Y, et al. , Adaptive-weighted total variation minimization for sparse data toward low-dose x-ray computed tomography image reconstruction. Phys Med Biol, 2012. 57(23): p. 7923–56. [DOI] [PMC free article] [PubMed] [Google Scholar]
- 40.Liu Y, et al. , Median prior constrained TV algorithm for sparse view low-dose CT reconstruction. Comput Biol Med, 2015. 60: p. 117–31. [DOI] [PubMed] [Google Scholar]
- 41.Niu S, et al. , Sparse-view x-ray CT reconstruction via total generalized variation regularization. Phys Med Biol, 2014. 59(12): p. 2997–3017. [DOI] [PMC free article] [PubMed] [Google Scholar]
- 42.Tang J, Nett BE, and Chen GH, Performance comparison between total variation (TV)-based compressed sensing and statistical iterative reconstruction algorithms. Phys Med Biol, 2009. 54(19): p. 5781–804. [DOI] [PMC free article] [PubMed] [Google Scholar]
- 43.Bredies K, Kunisch K, and Pock T, Total Generalized Variation. SIAM Journal on Imaging Sciences, 2010. 3(3): p. 492–526. [Google Scholar]
- 44.Beck A and Teboulle M, A Fast Iterative Shrinkage-Thresholding Algorithm for Linear Inverse Problems. Siam Journal on Imaging Sciences, 2009. 2(1): p. 183–202. [Google Scholar]
- 45.Combettes PL and Pesquet JC, A proximal decomposition method for solving convex variational inverse problems. Inverse Problems, 2008. 24(6): p. 065014. [Google Scholar]
- 46.Knoll F, et al. , Second order total generalized variation (TGV) for MRI. Magn Reson Med, 2011. 65(2): p. 480–91. [DOI] [PMC free article] [PubMed] [Google Scholar]
- 47.Hernandez AM and Boone JM, Tungsten anode spectral model using interpolating cubic splines: unfiltered x-ray spectra from 20 kV to 640 kV. Med Phys, 2014. 41(4): p. 042101. [DOI] [PMC free article] [PubMed] [Google Scholar]
- 48.Aamir R, et al. , MARS spectral molecular imaging of lamb tissue: data collection and image analysis. Journal of Instrumentation, 2014. 9(02): p. P02005–P02005. [Google Scholar]
- 49.Wang Z and Bovik AC, A universal image quality index. Ieee Signal Processing Letters, 2002. 9(3): p. 81–84. [Google Scholar]
- 50.Zhang L, et al. , FSIM: A Feature Similarity Index for Image Quality Assessment. IEEE Transactions on Image Processing, 2011. 20(8): p. 2378–2386. [DOI] [PubMed] [Google Scholar]
- 51.Niu T, et al. , Iterative image-domain decomposition for dual-energy CT. Med Phys, 2014. 41(4): p. 041901. [DOI] [PubMed] [Google Scholar]
- 52.Lauzier PT, Tang J, and Chen GH, Prior image constrained compressed sensing: implementation and performance evaluation. Med Phys, 2012. 39(1): p. 66–80. [DOI] [PMC free article] [PubMed] [Google Scholar]
- 53.Wang J, Guan H, and Solberg T, Inverse determination of the penalty parameter in penalized weighted least-squares algorithm for noise reduction of low-dose CBCT. Med Phys, 2011. 38(7): p. 4066–72. [DOI] [PubMed] [Google Scholar]
- 54.He J, et al. , Optimizing a Parameterized Plug-and-Play ADMM for Iterative Low-Dose CT Reconstruction. IEEE Transactions on Medical Imaging, 2018: p. 1–1. [DOI] [PubMed]
- 55.Li X, Ni J, and Wang G, Parallel iterative cone beam CT image reconstruction on a PC cluster. Journal of X-Ray Science and Technology, 2005. 13(2): p. 63–72. [Google Scholar]
- 56.Dong X, Niu T, and Zhu L, Combined iterative reconstruction and image-domain decomposition for dual energy CT using total-variation regularization. Med Phys, 2014. 41(5): p. 051909. [DOI] [PubMed] [Google Scholar]
- 57.Petrongolo M, Dong X, and Zhu L, A general framework of noise suppression in material decomposition for dual-energy CT. Med Phys, 2015. 42(8): p. 4848–62. [DOI] [PubMed] [Google Scholar]
- 58.Foygel Barber R, et al. , An algorithm for constrained one-step inversion of spectral CT data. Phys Med Biol, 2016. 61(10): p. 3784–818. [DOI] [PMC free article] [PubMed] [Google Scholar]


