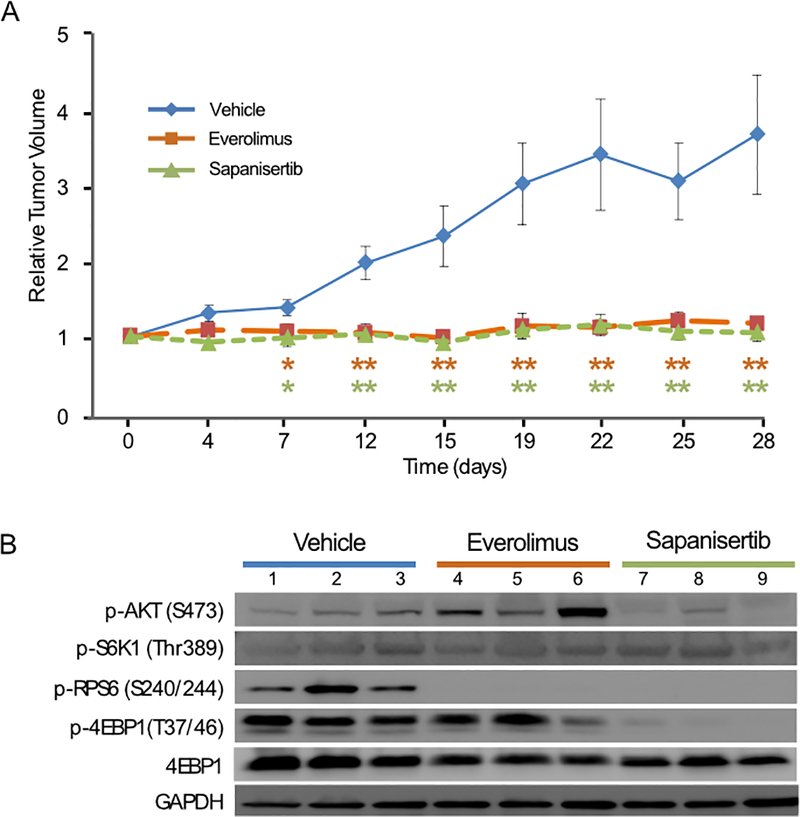
Figure 4.

Response of PDX-PNETs to the mTOR inhibitor drugs everolimus and sapanisertib. A, growth chart of PDX-PNETs treated with vehicle control, everolimus or sapanisertib for 28 days (vehicle control n=5, everolimus n=6, sapanisertib n=6). The p-values were calculated by 2-tailed Student’s t test (*p<0.05, **p<0.01). Error bars indicate the standard deviation from the mean. B, Western blot analysis of mTOR pathway targets in PDX-PNETs harvested after 28 days of treatment with either vehicle control, everolimus, or sapanisertib. Each lane represents a single xenograft harvested from a unique mouse.
