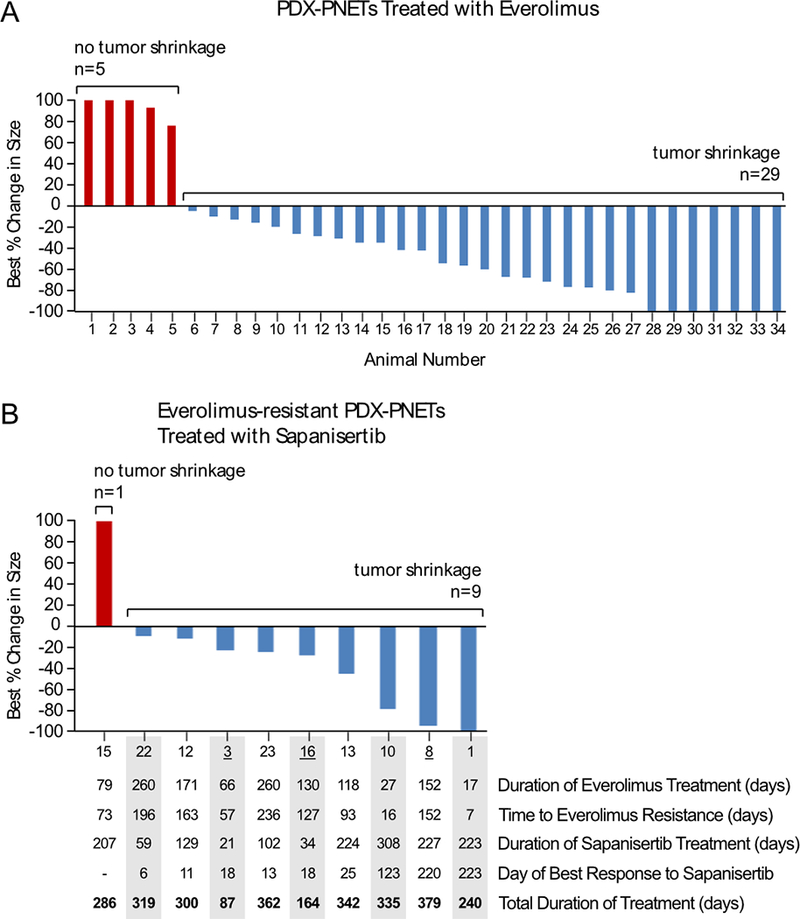
Figure 5.

Response of everolimus-resistant PDX-PNET tumors to sapanisertib. A, the best response of tumors treated with everolimus, as compared with pretreatment baseline (n=34). Numbers along the x-axis indicate arbitrarily assigned animal numbers in order of increasing percentage response to everolimus. The bars indicate the percent change in tumor burden from baseline. B, the best response to sapanisertib in 10 animals with everolimus-resistant PDX-PNET tumors. Selected tumor characteristics are listed in the table below the graph. Animals are listed in order of increasing percentage response to sapanisertib, with listed numbers corresponding to those in Figure 5A. Sapanisertib treatment ended when tumors either regressed (n=1), developed sapanisertib resistance and exceeded 5-times the original volume (n=6), or animals died (n=3). Underlined numbers indicate animals that died during treatment.
