
Figure 4. STING presence only in myeloid cells exacerbates HFD-induced NAFLD.
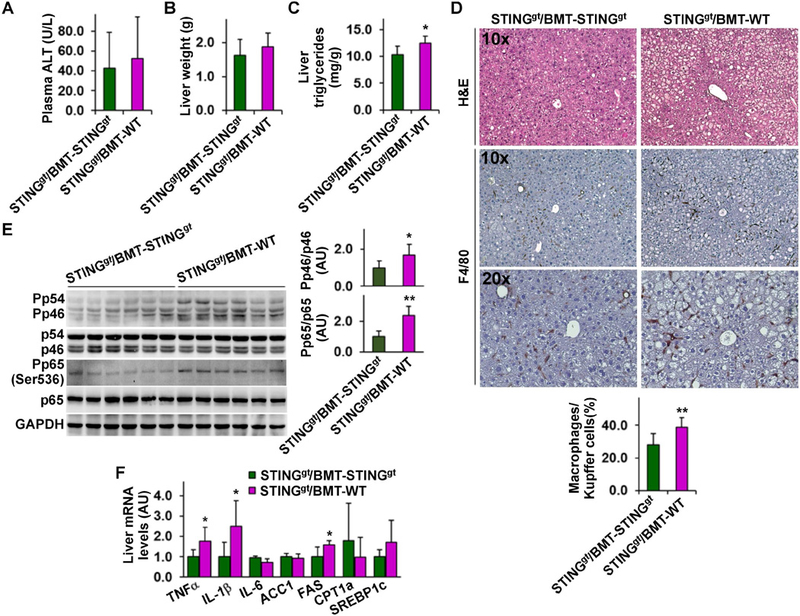
Male STINGgt mice, at 5 – 6 weeks of age, were lethally irradiated and transplanted with bone marrow cells from WT and/or STINGgt mice. After recovery for 4 weeks, the chimeric mice were fed an HFD for 12 weeks. (A) Plasma levels of ALT. (B) Liver weight. (C) Liver levels of triglycerides. (D) Liver sections were stained with H&E (top row) or for F4/80 expression (bottom two rows). Bar graph, percentages of macrophages. (E) Liver lysates were examined for proinflammatory signaling using Western blot analysis. Bar graphs, quantification of blots. (F) Liver mRNA levels were examined using real-time RT-PCR. For A - F, STINGgt/BMT-WT, STINGgt mice received WT bone marrow cells; STINGgt/BMT-STINGgt, STINGgt mice received STINGgt bone marrow cells. For all bar graphs, data are means ± SD. n = 10 – 12. *, P < 0.05 and **, P < 0.01 STINGgt/BMT-WT vs. STINGgt/BMT-STINGgt (in C - E) for the same gene (in F).