Figure 2.
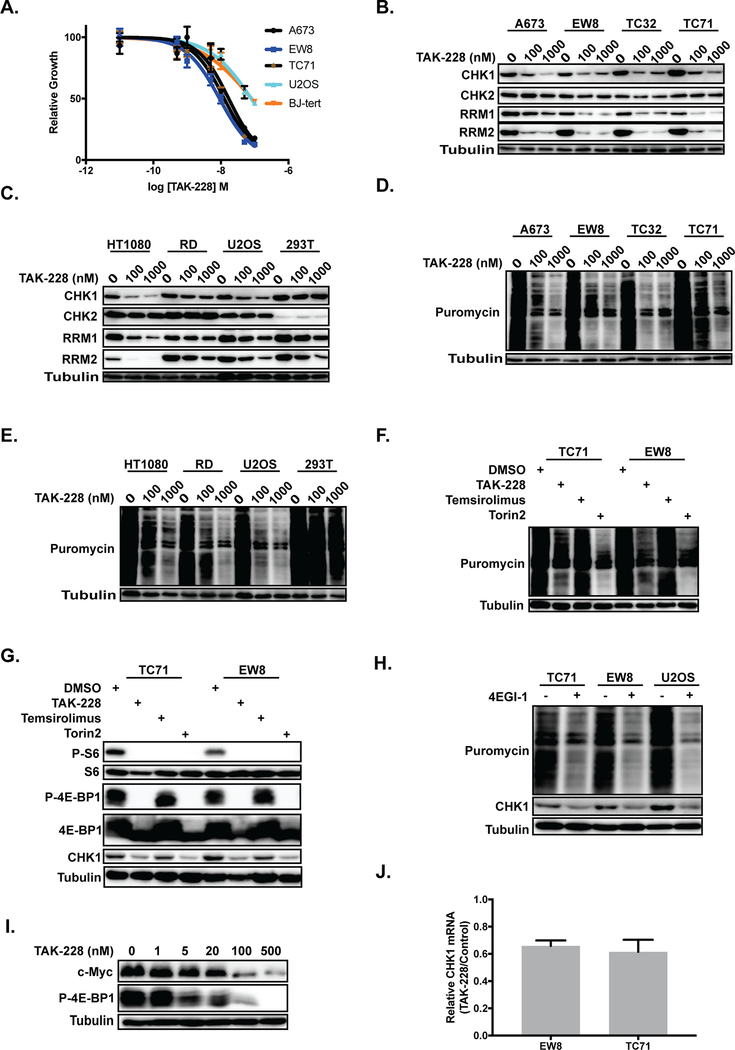
Inhibition of mTORC1/2 reduces protein synthesis and CHK1 levels in Ewing sarcoma cells. (A) Dose-response curves for cell lines treated with different concentrations of TAK-228 for 72 hours. Cell viability was then assessed using the AlamarBlue Fluorescence Assay. The results are representative of two independent experiments. Error bars represent mean ± SD of three technical replicates. (B, C) Immunoblot showing the effect of vehicle (DMSO) or TAK-228 on CHK1, CHK2, RRM1, and RRM2 levels in four Ewing sarcoma cell lines (B) and four other cell lines (C). (D, E) Immunoblot showing the effect of TAK-228 on protein synthesis, as assessed using puromycin labeling, in Ewing sarcoma (D) and other (E) cell lines. (F) Immunoblot assessing protein synthesis, using puromycin labeling, in Ewing sarcoma cells treated with mTORC1 (temsirolimus) and mTORC1/2 (TAK-228 and Torin2) inhibitors. (G) Immunoblot of the mTOR targets 4E-BP1 and ribosomal protein S6 (S6) in Ewing sarcoma cell treated with TAK-228, temsirolimus, and Torin2. (H) Immunoblot assessing protein synthesis, using puromycin labeling, and CHK1 levels of cell lines treated with the protein translation inhibitor 4EGI-1. (I) Immunoblot analysis of c-MYC and p-4E-BP1–37/46 in EW8 cells treated with different doses of TAK-228. (J) RT-qPCR for CHK1 mRNA in two Ewing sarcoma cell lines treated with 100 nM TAK-228 or DMSO. In all immunoblots, protein loading was normalized using cell number.

