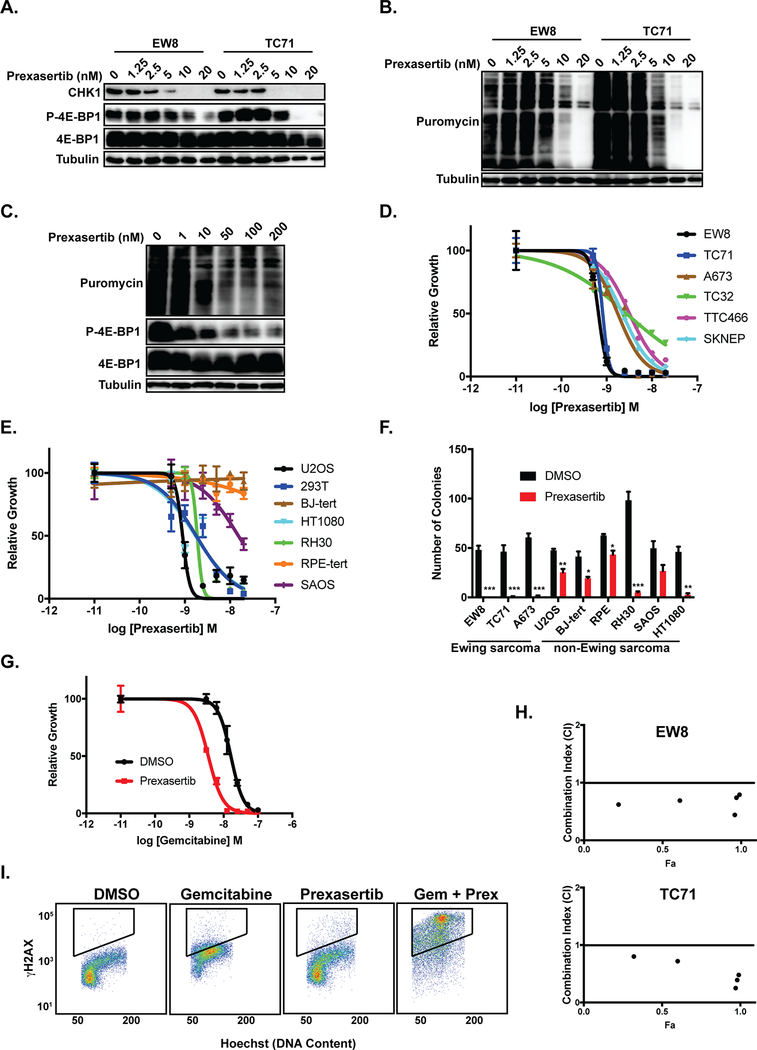
Figure 3.
Prexasertib inhibits the growth of Ewing sarcoma cells. (A) Immunoblot analysis of CHK1 and p-4E-BP1–36/47 in EW8 and TC71 cells treated with prexasertib. (B, C) Immunoblot assessing protein synthesis, using puromycin labeling, in two Ewing sarcoma cell lines (B) and U2OS osteosarcoma cells (C) treated with prexasertib. (D) Dose-response curves for 6 Ewing sarcoma cell lines treated with different concentrations of prexasertib for 24 hours. Cell viability was then assessed 48 hours later using the AlamarBlue Fluorescence Assay. The results are representative of two independent experiments. Error bars represent mean ± SD of three technical replicates. (E) Dose-response curves for 7 non-Ewing sarcoma cell lines treated with different concentrations of prexasertib for 24 hours. Experiment was performed as described in (E). (F) Cell lines were treated with prexasertib (5 nM) for 24-hours and cell growth was then quantified in colony formation assays. Error bars represent mean ± SD of three technical replicates ( ***, P-value < 0.0001; **, P-value < 0.001; *, P-value < 0.01). (G) Dose-response curve for EW8 cells treated for 6 hours with different concentrations of gemcitabine in the presence or absence of 1 nM prexasertib. Cell viability was then assessed 42 hours after drug removal using the AlamarBlue Fluorescence Assay. The results are representative of two independent experiments. Error bars represent mean ± SD of three technical replicates. (H) EW8 and TC71 cells were treated with different concentrations of gemcitabine and prexasertib, using a constant drug ratio, for 6 hours after which the drugs were removed and cell viability was measured 42 hours later. Data were analyzed using the CompuSyn software. Combination Index (CI) versus Fraction Affected (Fa) plot shows the effect of the combination of gemcitabine and prexasertib. CI < 0.9 indicates synergism. (I) The phosphorylation of H2AX was assessed using flow cytometry in EW8 cells treated with prexasertib (1 nM), gemcitabine (10 nM), or the combination of drugs.

