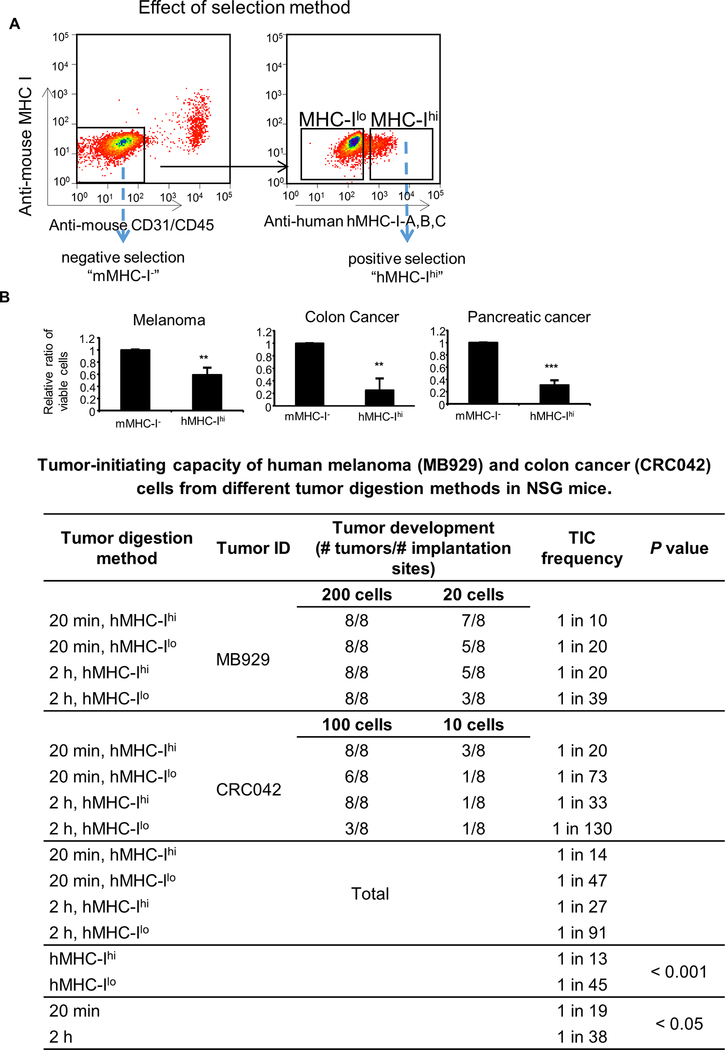
Figure 1. Effect of tumor isolation methods on viable cell number and tumor initiating capacity.
A, FACS sorting of PDX tumor cells that are negative for mouse CD31, mouse CD45 and mouse MHC I expression (negative selection, “mMHC-I-”) and those that are further positive for human MHC I expression (positive selection, “hMHC-Ihi”). B, Viable cell numbers and TIC frequency of PDX tumors. Upper panel, The number of viable cells after positive (“hMHC-Ihi”) selections were compared to those with negative (“mMHC-I-”). Mean ± SE, n = 3–4, **, P < 0.01; ***, P < 0.001. Lower table, Table depicting TIC frequency of PDX tumors. Tumor tissues were digested by collagenase IV for either 20 minutes (20 min) or 2 hours (2 h), excluded of mouse stromal cells (CD31/CD45/MHC-I), and sorted using human-MHC I staining to provide hMHC-Ihi cells and hMHC-Ilo tumor cells. Twenty or 200 cells of MB929 PDX tumor and 10 or 100 cells of CRC042 PDX tumor were subcutaneously injected into NSG mice with high-protein matrigel, and monitored for tumor formation for 24 weeks. L-Calc Software was used to calculate the TIC frequency (with 95% confidence interval).

