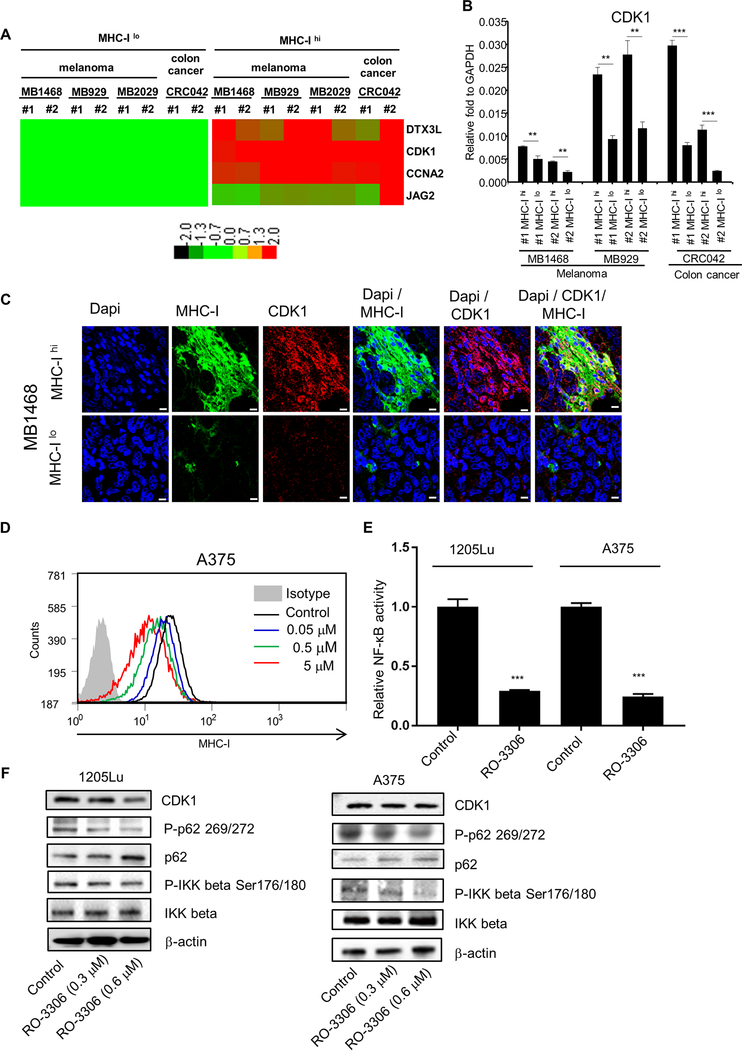
Figure 2. Identification of CDK1 from stem cell gene array.
A, nCounter stem cell gene array analysis between MHC-Ilo and MHC-Ihi cells. RNAs were isolated from 4 PDX tumors (MB1496, MB929, MB2029 and CRC042). #1 and #2 are biological replicates. Data were normalized by nSolver (NanoString), and displayed as a comparison to the expression levels from MHC-Ilo cells. Genes with significant changes were selected based on P < 0.05, fold change > 1.5, and an original readout > 50. The heat map was generated with TreeView. Red represents upregulated genes; Green represents downregulated genes. B, qRT-PCR validation of CDK1. #1 and #2 are biological replicates. Mean ± SE, n = 3. **, P < 0.01; ***, P < 0.001. C, Immunofluorescent images representing the localization of MHC I expression (Alexa flour 488, green) and CDK1 expression (Alexa flour 594, red) in MB1468 PDX tumor. Upper and lower panels represent regions where tumor cells highly expressed MHC I (MHC-Ihi) and poorly expressed MHC I (MHC-Ilo), respectively. Dapi (blue) was used as the nuclear stain. Scale bar = 10 μm. D, Flow cytometry data depicting the MHC I expression after CDK1 inhibitor RO-3306 treatment in A375 cells. E, Luciferase assays depicting the transcriptional activity of NF-κB after CDK1 inhibitor RO-3306 treatment (2 μM) in 1205Lu and A375 cells. Mean ± SE, n = 3. ***, P < 0.001. F, Immunoblots showing the phosphorylation of p62 and IKKβ after RO-3306 treatment (0.3 or 0.6 μM) in 1205Lu and A375 cells.

