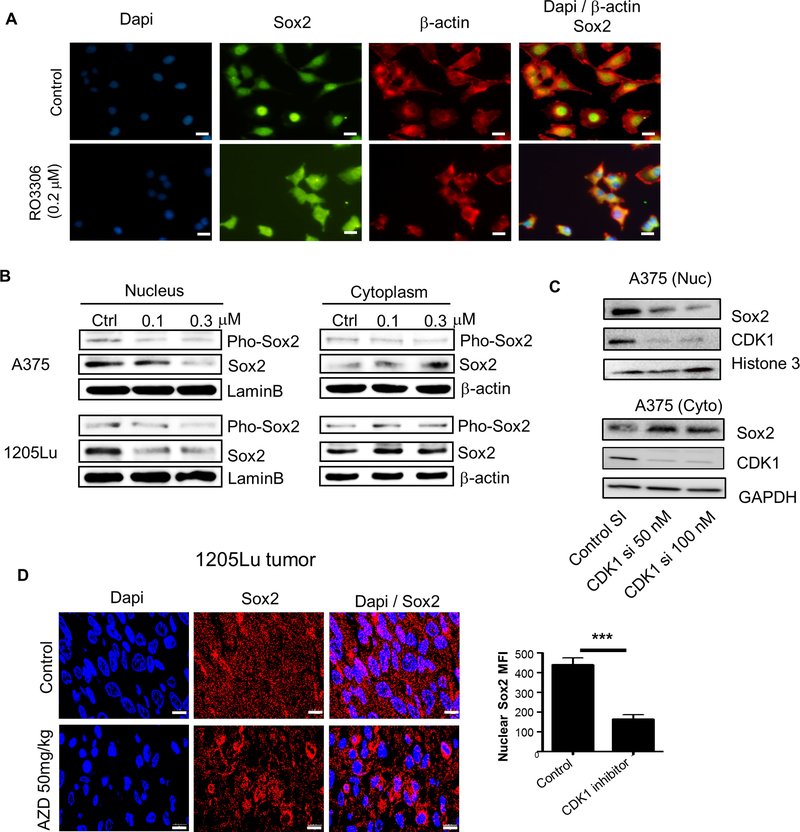
Figure 5. Effect of CDK1 inhibitor on Sox2 subcellular localization.
A, Immunofluorescent images representing the nuclear/cytoplasmic localization of Sox2 (Alexa flour 488, green) and β-actin (Alexa flour 594, red) after RO-3306 treatment in A375 cells. Dapi (blue) was used for the nuclear stain. Scale bar = 10 μm. B, Immunoblots of phosphorylated Sox2 and total Sox2 in the nucleus and cytoplasm after RO-3306 treatment in A375 and 1205Lu cells. LaminB and β-actin served as internal controls for nuclear and cytoplasmic protein, respectively. C, Immunoblots depicting the nuclear (Nuc) and cytoplasmic (Cyto) localization of Sox2 and CDK1 after CDK1 siRNA knockdown in A375 cells. D, Left panel, Immunofluorescent images representing the nuclear/cytoplasmic localization of Sox2 (Alexa flour 594, red) in 1205Lu xenograft tumors, shown in Supplementary Fig. S3C, treated with AZD5438 (50 mg/kg) by daily oral gavage for 14 days in comparison to untreated tumors. Right panel, MFI quantification of nuclear Sox2 in cells from untreated and AZD5438-treated tumors. Mean ± SE, n = 30. ***, P < 0.001. Scale bar = 10 μm.

