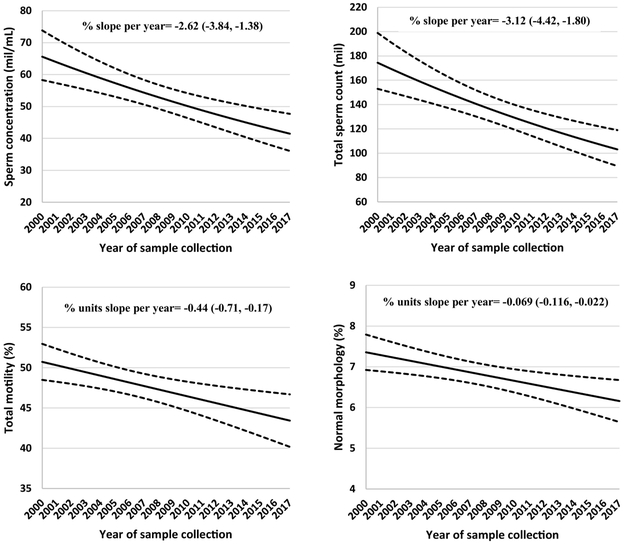
Figure 1. Secular trends in sperm concentration, total sperm count, sperm motility and normal morphology among men attending a fertility center in Boston between 2000 and 2017.
The solid lines represent the adjusted mean for semen parameters by year of sample collection, the dotted lines are the upper and lower 95% confidence intervals for the adjusted means. Adjusted means are presented for average abstinence time (2 days). N=936 men and 1,618 semen samples for all parameters except sperm morphology, which was assessed in 1,482 semen samples.

