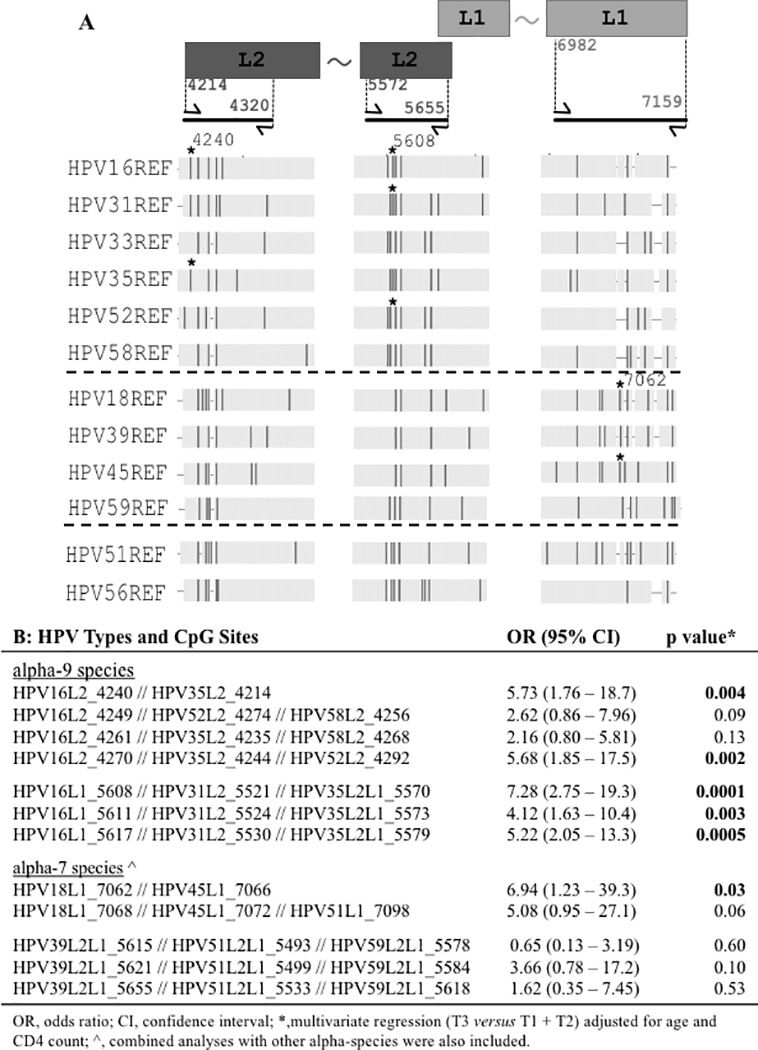
Figure 2. Multiple HPV sequence alignment to identify and test homologous CpG sites associated with cervical precancer.

Panel A shows a schematic of the L1 and L2 genes (not to scale) at the top right and top left, respectively. The PCR amplicons of bisulfite treated DNA are shown below the rectangles as thick black lines. The flanking arrows represent forward and reverse primers with the 5’ positions of the primers indicated between the rectangular boxes and the corresponding arrows. The two amplicons with the L2 region use HPV16 nucleotide positions; the amplicon region within the L1 gene corresponds to HPV18 nucleotide positions. The tilde between the rectangles indicates continuity of the gene. The vertical dark bars indicate the location of individual CpG sites for the HR-HPV types shown to the left of the figure. The asterisk (*) marks CpG sites (nucleotide positions 4240 and 5608 for HPV16, and 7062 for HPV18) listed in panel B with the highest significant OR. Alpha species groups are separated by dashed lines alpha-9, alpha-7, and alpha-5/alpha-6 from top to bottom. Panel B shows combinations of homologous CpG sites analyzed for association with cervix precancer. The ORs were calculated by dichotomizing the CpG methylation levels into high or low based on the top tertile (T3) compared to the lower tertiles (T1 and T2). The tertiles were determined for each HPV type and CpG site separately: the methylation of the controls for the HPV type at the CpG site was used to select the cut-off values, which were then used to define the tertiles for the HPV type at the corresponding CpG site. The data for the HPV types and CpG sites within the homologous CpG sites was combined and the GEE (generalized estimating equation) models were adjusted for age and CD4 count to calculate the ORs, 95% confidence interval and p-values.
