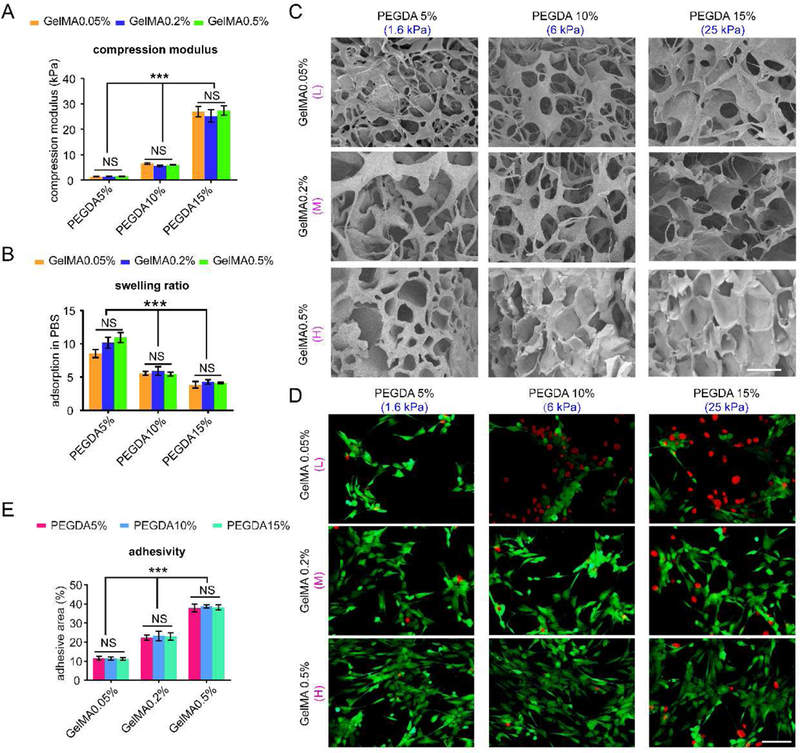
Fig. 2. Evaluation of the hydrogels.

(A) Compression modulus of 9 hydrogels after gelation, n=3. (B) Swelling ratio of 9 scaffolds, n=3. (C) SEM images of different hydrogels after freeze drying. Scale bar: 100 µm. (D) Representative images of osteoblasts attached on the surface of the 9 hydrogels after 24 h. Scale bar: 50 µm. (E) Percentage of adhesive area of osteoblasts cultured on 9 hydrogel surfaces after 24 h per view. n=10; mean ± SD; *P<0.05, **P<0.01, ***P<0.001; NS, not significant. L, M and H correspond to low (0.05% GelMA), middle (0.2% GelMA) and high (0.5% GelMA) adhesion ligand density.
