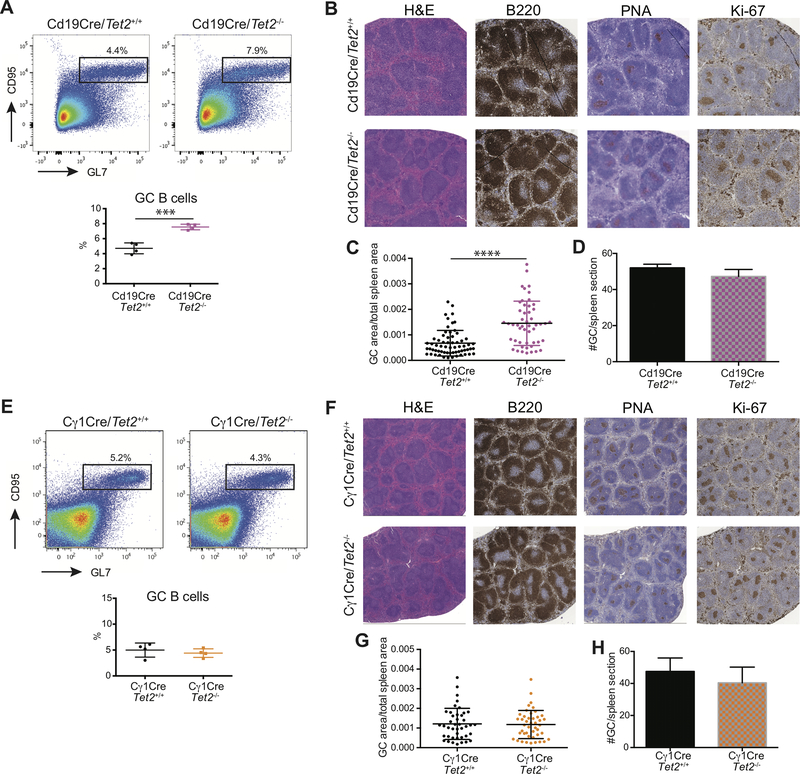
Figure 2. GC hyperplasia induced by Tet2 loss of function is B-cell autonomous.
A, Representative flow cytometry plot and quantification of (B220+CD95+GL7+) GC B-cells from Cd19-Cre/Tet2+/+ (n=4) and Cd19-Cre/Tet2−/− (n=4) mice at day 10 after immunization with SRBC. B, Representative histologic sections of formalin-fixed, paraffin-embedded spleens from Cd19-Cre/Tet2+/+ and Cd19-Cre/Tet2−/− mice. Sections were stained with H&E and antibodies specific for B220, PNA and Ki-67. C, D, Quantification of GC area (C) and number of GCs (D) in the spleens of Cd19-Cre/Tet2+/+ and Cd19-Cre/Tet2−/− mice. E, Representative flow cytometry plot and quantification of (B220+CD95+GL7+) GC B-cells from Cγ1-Cre/Tet2+/+ (n=5) and Cγ1-Cre/Tet2−/− (n=5) mice at day 10 after immunization with SRBC. F, Representative histologic sections of formalin-fixed, paraffin-embedded spleens from Cγ1-Cre/Tet2+/+ and Cγ1-Cre/Tet2−/− mice. Sections were stained with H&E and antibodies specific for B220, PNA and Ki-67. G, H, Quantification of GC area (G) and number of GCs (H) in the spleens of Cγ1-Cre/Tet2+/+ and Cγ1-Cre/Tet2−/− mice. two-tailed t test, ***p<0.001 ****p<0.0001.

