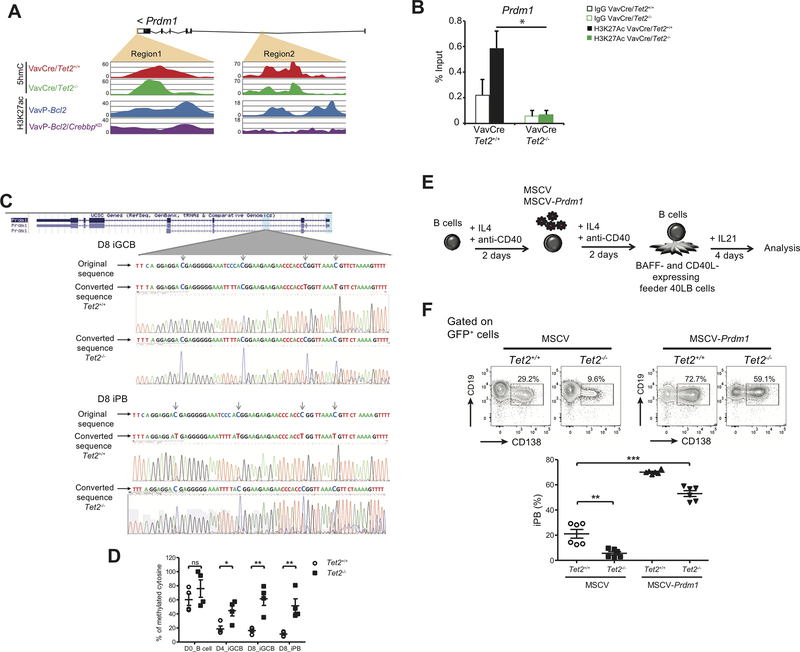
Figure 6. Aberrant repression of Prdm1 contributes to the phenotype of TET2-deficient B cells.
A, Read-density tracks of H3K27ac histone modification as well as 5hmC levels in Prdm1 locus in Vav-Cre/Tet2−/−, Vav-Cre/Tet2+/+, VavP-Bcl2 and VavP-Bcl2/CrebbpKD B-cells. Areas marked in orange indicate regions losing 5hmC and H3K27ac signals. B, H3K27Ac enrichment in region 1 shown in A. C, (Top) Prdm1 DNA methylation status in iGCB cells on D8. Shown are DNA original sequence (upper line), representative bisulfite-converted DNA sequence of Tet2+/+ iGCB cells (middle line), and representative bisulfite-converted DNA sequence of Tet2−/− iGCB cells (lower line). The experiment was performed with 3 biological replicates. (Bottom) Prdm1 DNA methylation status in iPB on D8. Shown are DNA original sequence (upper line), representative bisulfite-converted DNA sequence of Tet2+/+ iPB (middle line), and representative bisulfite-converted DNA sequence of Tet2−/− iPB (lower line). The experiment was performed with 2 biological replicates. D, Quantification of DNA methylation by Methylation-sensitive restriction enzyme qPCR. Differentially methylated region represented as the percentage of methylated cytosine in Prdm1 gene were validated in Day0 (D0, naïve) B cells, day4 (D4) iGCB cells, day8 (D8) iGCB cells and day8 (D8) iPB cells (n=4). E, Schematic illustration of the ectopic expression of PRDM1 in B cells. Briefly, IL4 and anti-CD40 treated naïve B cells for 2 days and were infected with a retrovirus expressing GFP or PRDM1-GFP. After 2 more days of culture with IL4 and anti-CD40, cells were harvested and cultured in the presence of 40LB feeder cells and IL21 for 4 days. F, GFP-positive cells were analyzed for CD19 and CD138 expression. Representative plots of FACS analysis of the in vitro induced CD19+CD138+ population. Histograms represent the percentage of iPB (CD19+CD138+); symbols represent triplicate of 2 independent experiments.

