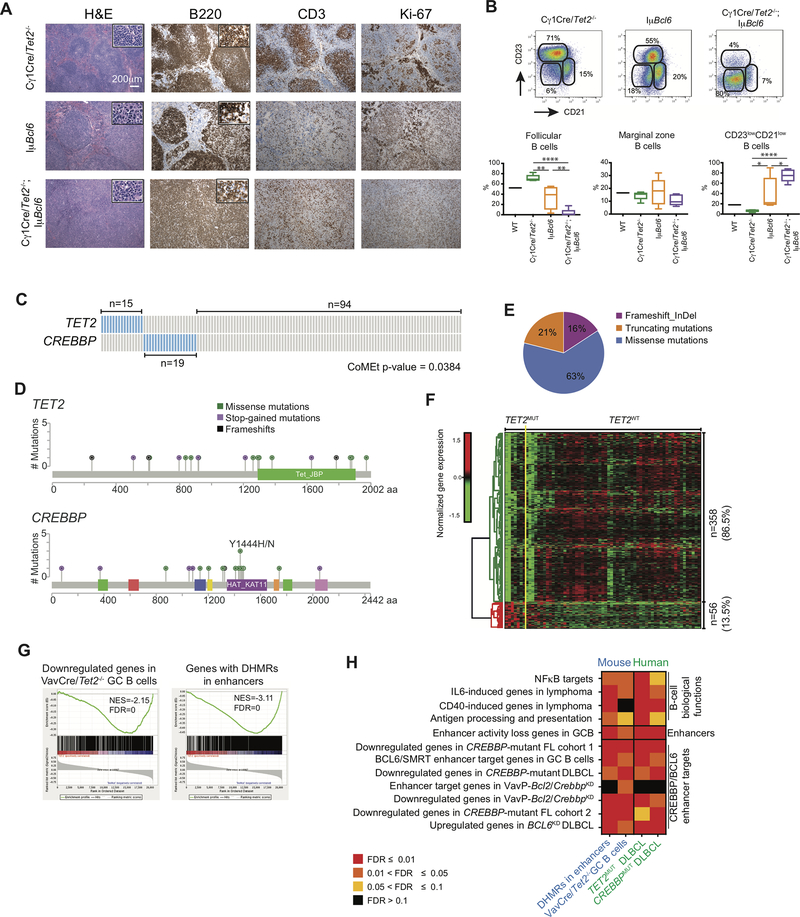
Figure 7. TET2 mutations in human DLBCLs manifest the Tet2-deficient GC gene signature, and similarities to CREBBP mutant cases.
A, Representative histologic sections of formalin-fixed, paraffin-embedded spleens from Cγ1Cre/Tet2−/−;IμBcl6, Cγ1Cre/Tet2−/− and IμBcl6 mice. Sections were stained with H&E and antibodies specific for B220, CD3 and Ki-67. B, Representative flow cytometry plot and quantification of CD23+CD21+ (follicular B cells), CD23−CD21+ (marginal zone B cells) and CD23−CD21− B cells in the spleens of Cγ1Cre/Tet2−/−;IμBcl6, Cγ1Cre/Tet2−/− and IμBcl6 mice; two-tailed t test, *p < 0.05 **p < 0.01 ****p < 0.0001. C, Mutation matrix for TET2 and CREBBP mutations in a cohort of 128 DLBCL. Blue color indicates any type of mutation while grey indicate no known mutations of the gene. Each of the 128 columns indicates one patient sample. Mutual exclusivity on TET2 and CREBBP mutations was computed using CoMEt. D, Lolliplot of the TET2 and CREBBP mutations, plotted using MutationMapper (74,75). E, Distribution of insertions/deletions and mutations among TET2 mutant DLBCL. F, Normalized gene expression levels of 414 differentially expressed genes between TET2 mutant (TET2MUT) and non-mutant (TET2WT) DLBCL. TET2MUT indicate 7 samples with either stop-codon of frameshift mutation, while TET2WT indicate 60 samples without any kind of mutation in TET2 or CREBBP genes. Expression levels were scaled by row. G, GSEA enrichment plots showing correlation of different genesets with ranked expression change between TET2MUT and TET2WT DLBCL. NES, normalized enrichment score; FDR, false discovery rate. H, Heatmap of the FDR scores for the enrichment of 12 gene sets involved in the exit of GC B-cells from the GC. FDR scores were obtained using hypergeometric test for mouse genes with enhancers overlapping DHMR, described as “DHMR in enhancers” and shown previously Fig. 6F. Column described as “Vav-Cre/Tet2−/− GC B cells” presents the FDR scores obtained using GSEA, also shown on Fig. 5D. Columns “TET2MUT DLBCL” and “CREBBPMUT DLBCL” indicate GSEA-based FDR scores of the enrichment of the gene sets in DLBCL.

