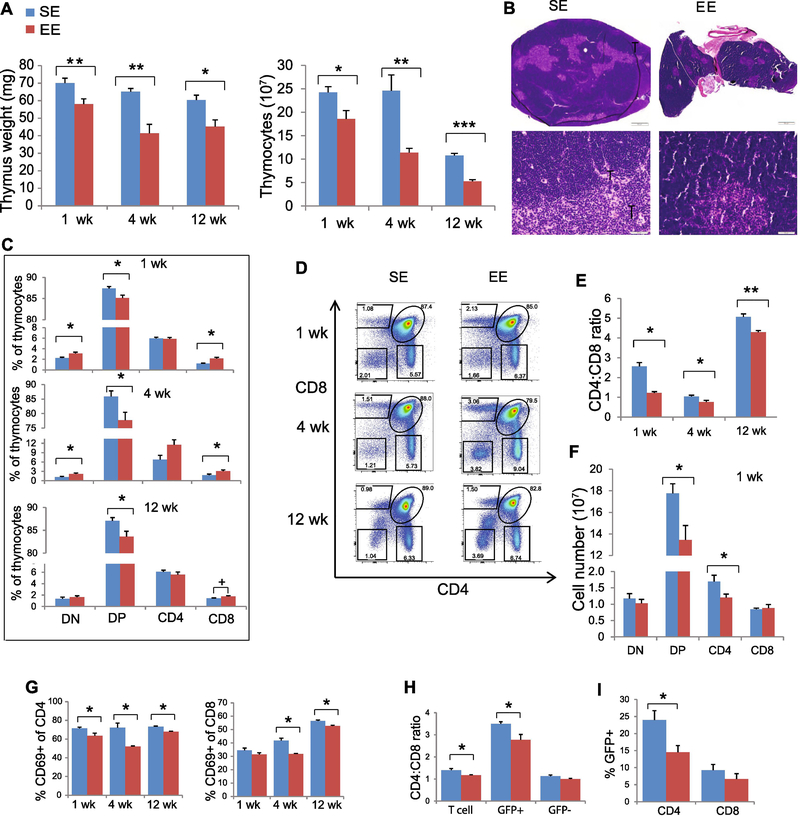
Figure 1. EE modulates thymocyte development and T cell emigration.
(A) Thymus weight and total thymocyte numbers at 1-, 4- and 12-weeks EE. (B) H&E staining of thymus at 1 week EE. (C) Thymocyte subsets. (D) Representative FACS analyses for CD4 and CD8 expression on thymocytes. (E) The ratio of TCRβ+ CD4+: TCRβ+ CD8+ in thymus. (F) Numbers of thymocyte subsets at 1-week EE. (G) Percentage of CD69+ cells of CD4 or CD8 SP cells. (H) CD4:CD8 ratio in lymph node from Rag2-GFP mice. (I) Percentage of GFP+ cells in CD4 and CD8 T cells in spleen from Rag2-GFP mice. Data represent mean ±SEM; n =10–15 per group for 1- and 4- weeks and 5 per group for 12-week EE (A-F); n=5–10 per group (G-I) * P < 0.05, ** P < 0.01, *** P<0.001, + P=0.08, unpaired t test.

