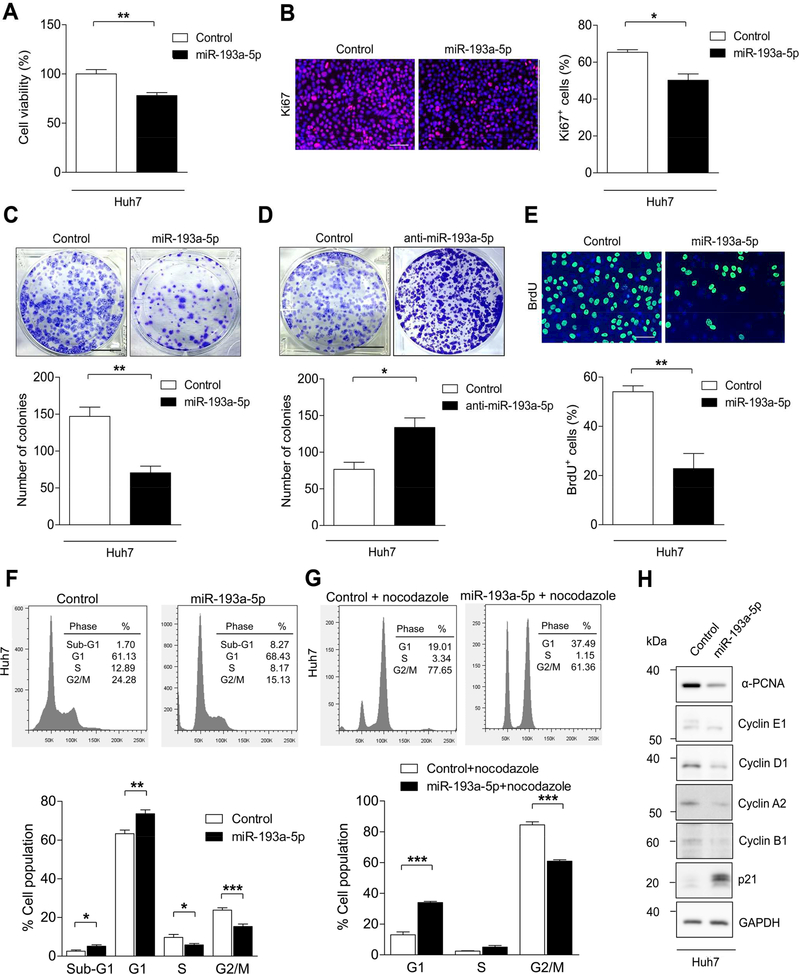
Figure 2.
Overexpression of miR-193a-5p suppresses the progression of cell cycle in vitro. (A) Huh7 cells were transfected with miR-193a-5p mimic and Control siRNA and cell viability was analyzed by CCK-8 assay (n = 4 per group). (B) Representative immunofluorescence images and quantification of Ki67 staining of Huh7 cells transfected with miR-193a-5p mimic or Control siRNA (n = 3 per group) (bar = 50 μm). (C) Colony formation assay was performed after transfection of Huh7 cells with miR-193a-5p mimic or Control siRNA (n = 4 per group) (bar = 1 cm). (D) Colony formation assay was performed after transfection of Huh7 cells with miR-193a-5p Antagomir and Control (miScript Inhibitor Negative Control) (n = 4 per group) (bar = 1 cm). (E) Representative images and quantification of BrdU+ Huh7 cells transfected with miR-193a-5p mimic or Control siRNA (n = 3 per group). (F) Huh7 cells were transfected with miR-193a-5p for 72 h and analyzed with flow cytometry (FACS) by DAPI staining (n = 6 per group). The percentage of cells in sub-G1, G1, S and G2/M phases of the cell cycle are indicated. (G) Huh7 cells were transfected with miR-193a-5p and treated with nocodazole (100 ng/ml) for 24 h before addition of DAPI and analyzed by FACS (n = 6 per group). The percentage of cells in the G1, S and G2/M phases of the cell cycle are indicated. (H) Western Blot showing the protein expression of the indicated proteins in Huh7 cells transfected with either miR-193a-5p mimic or Control siRNA (n = 3 per group). Results are represented as mean ± SEM. * p<0.05, ** p<0.01, *** p<0.001 by 2- tailed, unpaired t test.

