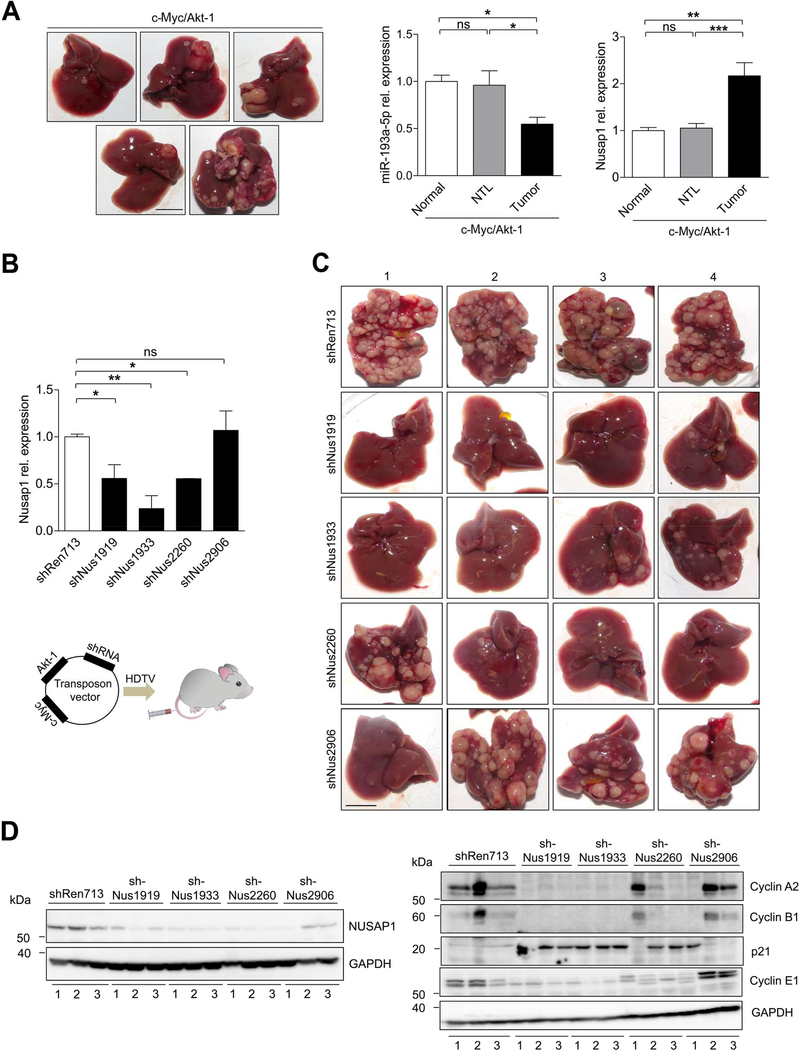
Figure 7.
Knockdown of NUSAP1 limits liver cancer development in a transposon- based endogenous mouse HCC model (A) Representative images of mouse livers that developed c-myc/Akt-1 driven liver cancer 8 weeks after hydrodynamic injection (n = 5) (bar = 1 cm). qRT-PCR showing the relative expression of miR-193a-5p and NUSAP1 in normal livers, non-tumoral liver (NTL) and liver tumors isolated from c-Myc/Akt-1 injected mice. (B) Top panel: The efficiency of each shRNA used for HDTV experiments was determined by qRT-PCR in retroviral transfected liver cancer cells isolated from c-Myc/Akt-1 driven tumors of p19−/− mice. Lower panel: Schematic diagram illustrating the HDTV injection vector containing either shREN713 (Control) or the varying sequences of shNUSAP1 along with cMyc and Akt-1. (C) Representative images of tumor burden 7 weeks after delivery of transposon vectors containing either shREN713 as a control or the respective sequences bearing shNUSAP1 (shNUS1919, shNUS1933, shNUS2260, shNUS2906) (n = 4 per group) (bar = 1 cm). (D) Western Blot of NUSAP1 and cyclins (CyclinE1, CyclinA2, CyclinB1 and p21) with protein extracts from c-Myc/Akt-1/shRNA HDTV-injected livers (n = 3 per group) corresponding to the respective liver number (1–3) as indicated in Figure 7C. Results are represented as mean ± SEM. ns: non-significant, * p<0.05, ** p<0.01, *** p<0.001 by 1-way ANOVA with Newman-Keuls post-hoc test (A and B).

