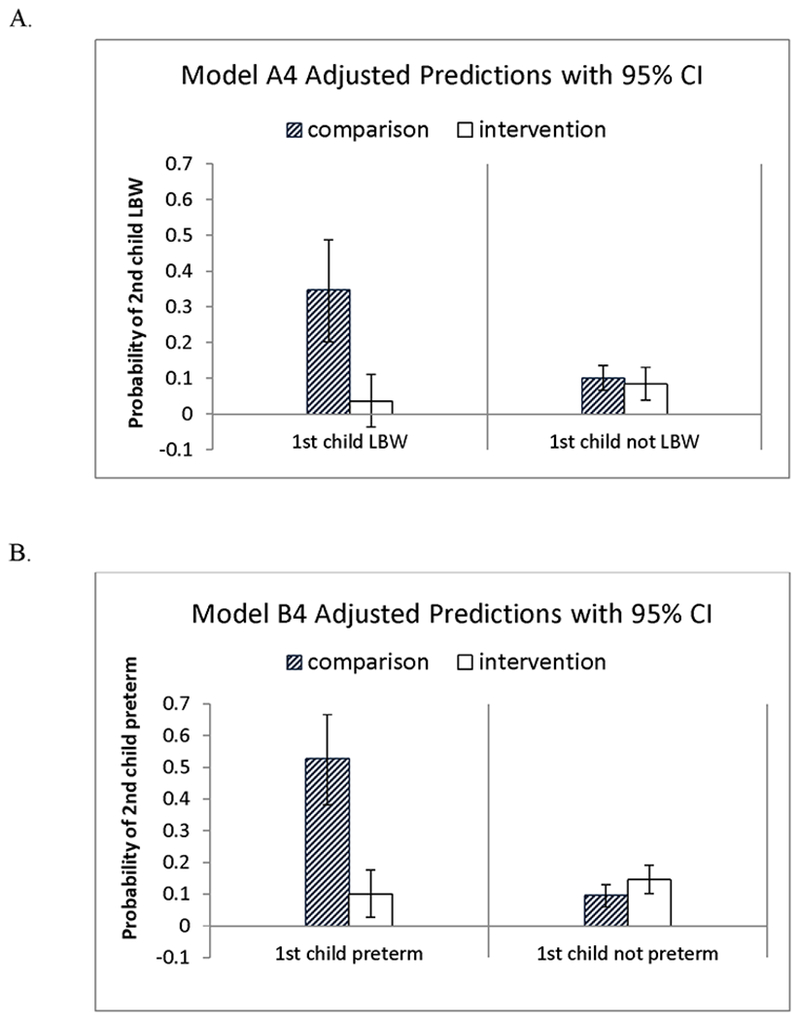
Figure 2:

Interactions between the first child being born with low birthweight, or preterm, and the mother being in the original intervention group are illustrated for Models A4 and B4. A. The left pane in the top figure shows that, when the first child has low birthweight (LBW), the intervention effect is substantial; the right pane shows, when the first child does not have low birthweight, there is not detectable intervention effect; 95% confidence intervals are indicated with error bars. B. The bottom figure shows the same information for preterm birth.
