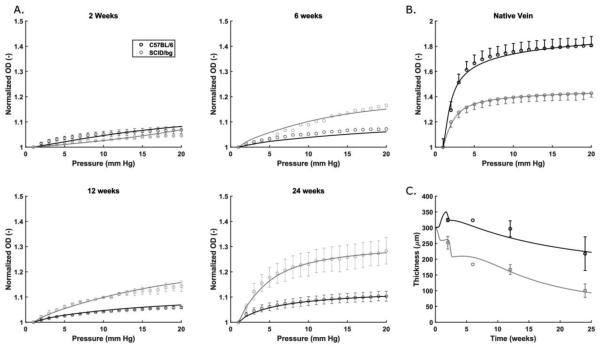
Fig. 3.
Normalized outer diameter (OD) plotted versus luminal pressure for (A) grafts explanted from C57BL/6 (dark) and SCID/bg (light) mice after 2, 6, 12, or 24 weeks and (B) native veins from both mouse models. (C) Evolution of TEVG thickness, at physiological loading, for grafts explanted from both mouse models. In each case, experimental data (mean±SEM) are represented symbolically and model fits as solid lines.

