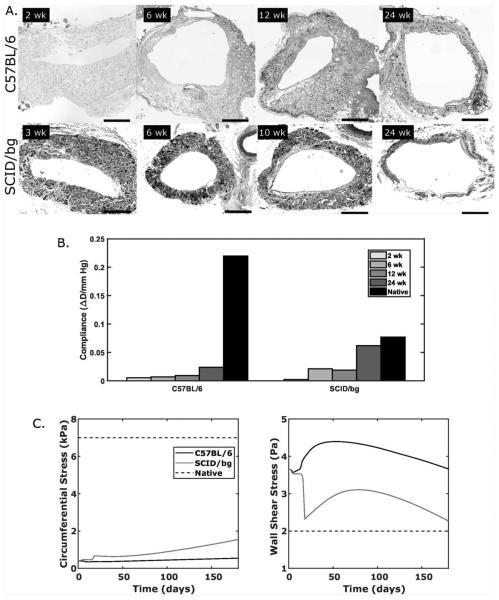
Fig. 5.
(A) Representative micrographs of grafts explanted from C57BL/6 (top) and SCID/bg (bottom) mice over 24 weeks. (B) Predicted values of evolving normalized diameter compliance compared to native compliance over 2 to 3 mmHg. (C) Predicted evolution of pressure-induced circumferential wall stress and flow-induced wall shear stress, which drive mechano-mediated matrix production, for both mouse models as a function of G&R time. Normal, unchanging, values of each are shown as native (dashed).

