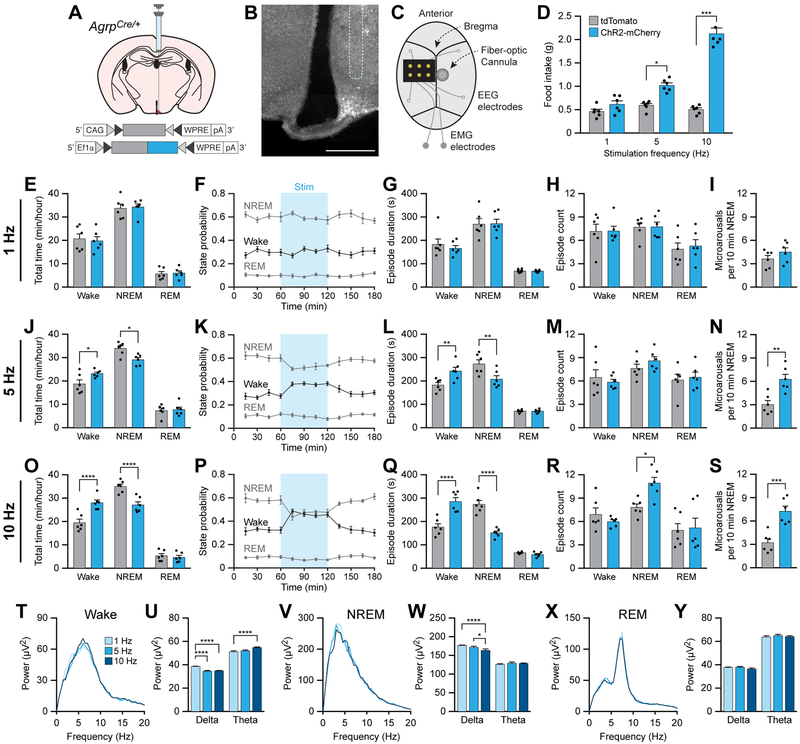
Figure 2. Optogenetic stimulation of AgRP neurons increases wakefulness and disrupts sleep integrity.
(A) Diagram showing viral injection strategy to unilaterally target AgRP neurons with tdTomato or ChR2-mCherry.
(B) Representative photomicrograph showing AgRP neurons expressing ChR2-mCherry. Dashed line shows approximate location of cannula track. Scale bar, 500 μm.
(C) Diagram showing placement of EEG/EMG implant, EEG electrodes, and fiber-optic cannula on the skull. EMG electrodes were placed within the nuchal musculature.
(D) Optogenetic stimulation of AgRP neurons for 1 h at 5 or 10 Hz increases food intake.
(E-I) Optogenetic stimulation of AgRP neurons for 1 h at 1 Hz does not affect (E) the total time (F) state probability, (G) episode duration, or (H) episode count of wake, NREM sleep, and REM sleep states, nor does it affect (I) the frequency of microarousal events during NREM sleep.
(J-N) Optogenetic stimulation of AgRP neurons for 1 h at 5 Hz (J,K) increases total time in wakefulness and decreases total time in NREM sleep, (L) increases wake and decreases NREM sleep episode duration, and (N) increases the frequency of microarousal events during NREM sleep, but (M) does not affect the number of wake, NREM sleep, or REM sleep episodes.
(O-S) Optogenetic stimulation of AgRP neurons for 1 h at 10 Hz (O,P) increases total time in wakefulness and decreases total time in NREM sleep, (Q) increases wake and decreases NREM sleep episode duration, (R) increases the number of NREM sleep episodes, and (S) increases the frequency of microarousal events during NREM sleep.
(T and U) Power spectra of EEG recorded during wakefulness (T), and (U) the average EEG power density in the delta and theta bands.
(V and W) Power spectra of EEG recorded during NREM sleep (V), and (W) the average EEG power density in the delta and theta bands.
(X and Y) Power spectra of EEG recorded during REM sleep (X), and (Y) the average EEG power density in the delta and theta bands.
Data represent the mean ± standard error of the mean (SEM). Dots represent individual experimental animals. T-tests and post hoc comparisons: *p<0.05, **p<0.01, ***p<0.001, ****p<0.0001; also see Table S1.

