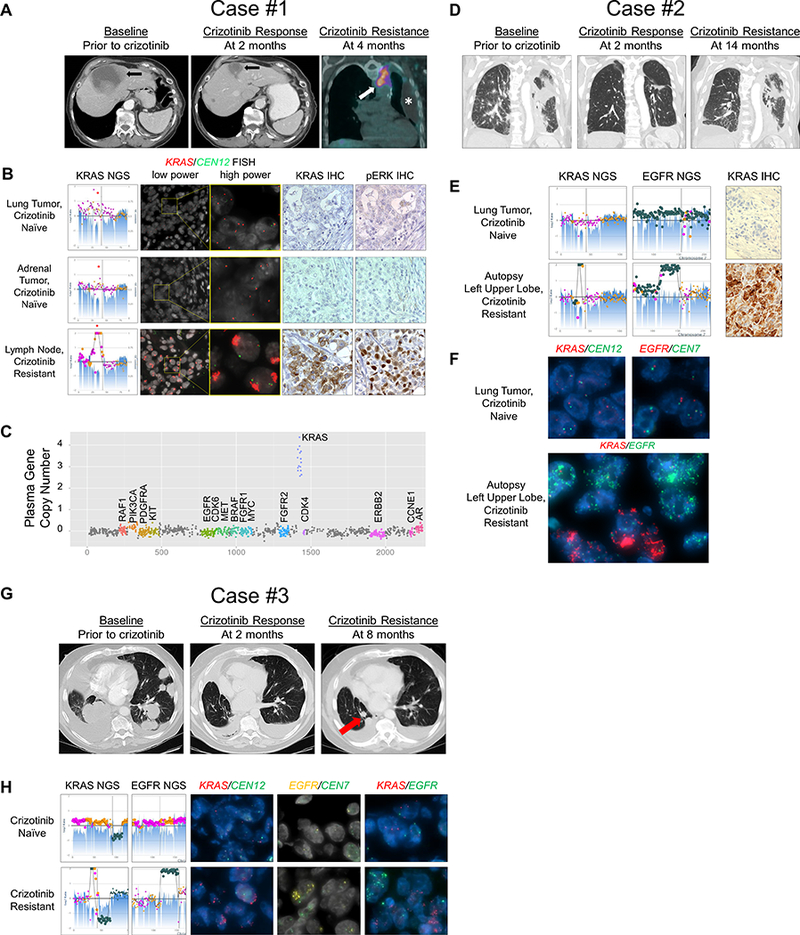
Figure 1.

Acquired wild-type KRAS amplification in three patients with MET exon 14 mutant NSCLC at the time of crizotinib resistance. A, Axial CT images of the upper abdomen for Case #1 showing a liver metastasis at baseline (left panel) which significantly decreased in response to crizotinib at 2 months of therapy (middle panel). Fused coronal image of the PET-CT scan obtained at 4 months of therapy (right panel) demonstrated FDG-avid, enlarging mediastinal adenopathy (arrow) and a new loculated left pleural effusion (asterisk) from which the DFCI358 cell line was derived. B, Next generation sequencing (NGS, left panels) copy number plots of the KRAS locus on chromosome 12 from two crizotinib-naïve tumors from Case #1 and the crizotinib-resistant supraclavicular lymph node (bottom left panel) with estimated 55–75 copies of KRAS. Fluorescence in situ hybridization (FISH) for KRAS (red) and centromere 12 (CEN12, green) is shown at low and high power for the crizotinib naïve and resistant samples. Immunohistochemistry (IHC) for KRAS and phosphor-ERK (pERK) are also shown. C, Plasma gene copy number for several genes are displayed for Case #1 from blood taken at the time of crizotinib resistance. D, Coronal CT images for Case #2 showing a consolidated mass in the left upper lobe of the lung at baseline (left panel), which responded to crizotinib at 2 months of therapy (middle); however, progression with regrowth of left lung tumor was noted at 14 months indicative of the development of acquired resistance (right). E, NGS copy number plots of the KRAS locus on chromosome 12 and the EGFR locus on chromosome 7 are shown for the pre- and post-crizotinib samples for Case #2. Post-crizotinib sample shows estimated 25 copies of KRAS in the upper lobe. KRAS IHC before and after crizotinib treatment are also shown. F, KRAS (red) and CEN12 (green) FISH (top left) and EGFR (red) and centromere 7 (CEN7, green) FISH (top right) are shown in the crizotinib naïve tumor. Dual KRAS/EGFR (red/green, respectively) FISH in the crizotinib resistant tumor is shown (bottom panel). G, Axial CT images of the chest for Case #3 showing bilateral lung masses and a nodule at baseline (left), which partially responded to crizotinib (middle), followed by growth of one of the nodules in the right lower lobe (right, arrow), which was biopsied at the time of acquired resistance. H, NGS copy number plots of the KRAS and EGFR loci are shown for the pre- and post-crizotinib samples for Case #3. Post-crizotinib sample shows estimated 21 copies of KRAS. KRAS IHC before and after crizotinib treatment are also shown. FISH for KRAS/CEN12 (red/green, respectively), EGFR/CEN7 (yellow/green, respectively) and dual KRAS/EGFR (red/green) are shown in the crizotinib naïve and crizotinib resistant tumor samples.
