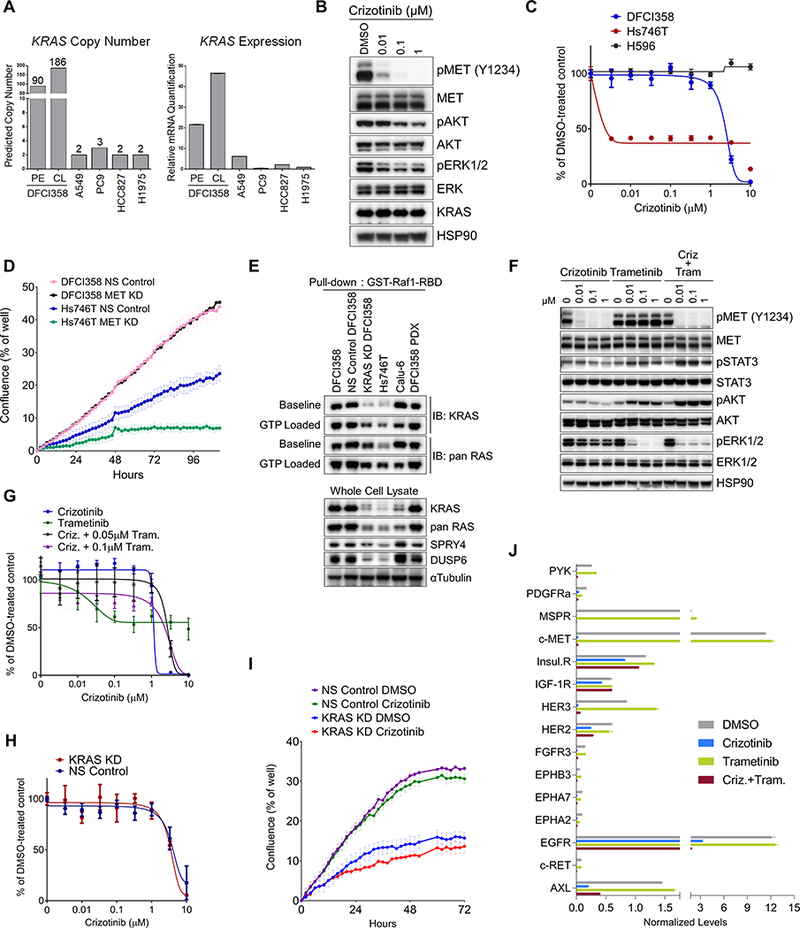
Figure 2.

KRAS amplified crizotinib resistant cells exhibit enhanced KRAS/MAPK/ERK signaling. A, Real time qPCR quantification of wild type KRAS copy number and transcript in DFCI358 tumor tissue, patient derived DFCI358 cell line, and non-amplified lung cancer cell lines for comparison. B, Western blot of MET inhibition and sustained downstream signaling in DFCI358 cell line following 6-hour crizotinib treatment. C, Dose-response curves of crizotinib resistant DFCI358, H596 and crizotinib sensitive Hs746T METex14 mutant cell lines treated with crizotinib for 3 days. D, IncuCyte analysis of proliferation as measured by confluence per well of DFCI358 or Hs746T cells, each transduced with either non-silencing siRNA (NS Control) or MET siRNA pool (MET KD), each at 50nM siRNA. Error bars represent standard error of the mean of 9 technical and 3 biological replicates in a 12-well format. E, Western blot of GTP-bound KRAS or pan RAS following pull-down with active RAS-reactive GST-Raf1-RBD fusion protein in parental, non-silencing control siRNA (NS Control), or KRAS siRNA transduced DFCI358 (KRAS KD), DFCI358 PDX cell line, Hs746T and Calu-6 cell lines. GTP loaded controls illustrate the maximum achievable GTP-bound KRAS levels. Baseline shows GTP-RAS levels without GTP incubation. αTubulin was used as a loading control. F, Western blot of DFCI358 cells treated with dose escalated crizotinib (criz), trametinib (tram), or crizotinib combined with 0.1 μM trametinib, for 6 hours. HSP90 was used as a loading control. G, Dose-response growth and viability curve of DFCI358 cells treated with dose-escalated crizotinib alone or in combination with trametinib for 3 days, assessed by MTS assay. H, Dose-response curve of DFCI358 transduced with non-silencing control (NS Control) or KRAS siRNA (KRAS KD), treated with dose-escalated crizotinib for 3 days and assessed by MTS assay. I, IncuCyte analysis of proliferation as measured by confluence per well of vehicle or crizotinib treated DFCI358 NS Control or KRAS KD cells. Error bars represent standard error of the mean of 9 technical and 3 biological replicates. J, Quantification of phospho-RTK array signals (shown in Supplementary Fig. S3B) following a 6-hour treatment with DMSO, crizotinib (criz), trametinib (tram) or the combination. The mean signal (n=2) was calculated and normalized to the mean reference signal (n=6). Error bars represent standard deviation of the mean.
