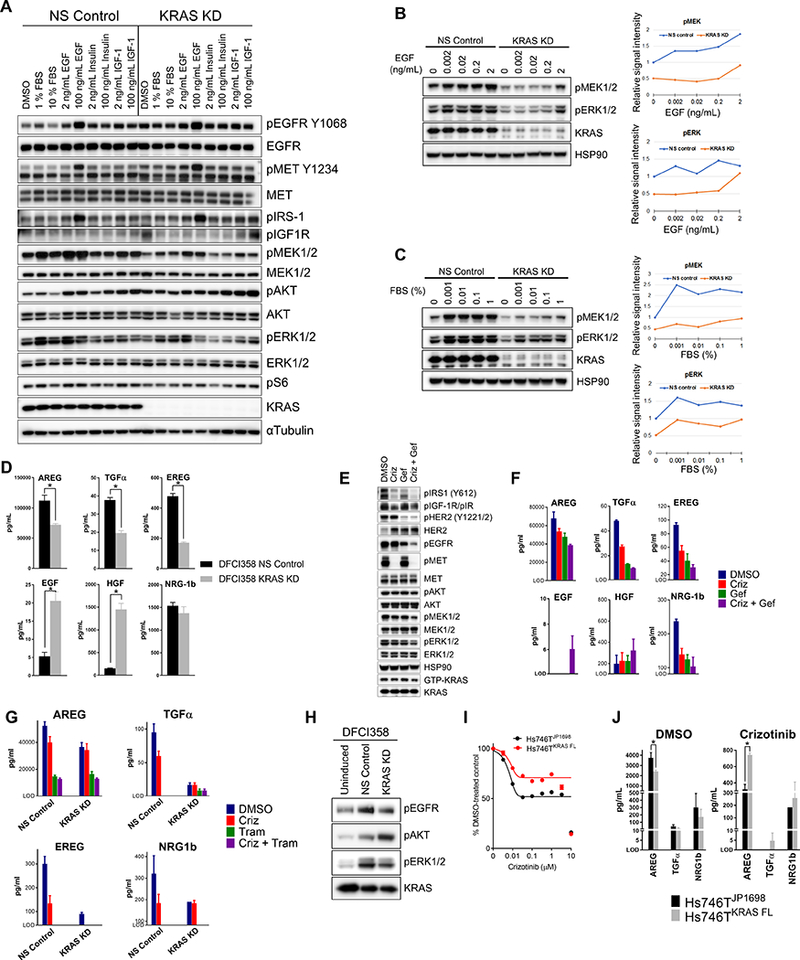
Figure 4.

KRAS amplified cells are hypersensitive to growth factor stimulation. A, Western blot of serum-starved growth factor induced DFCI358 transduced with either non-silencing control (NS Control) or KRAS siRNA (KRAS KD). αTubulin was used as a loading control. B, Western blot of serum-starved DFCI358 transduced with either non-silencing control (NS Control) or KRAS siRNA (KRAS KD) and induced with EGF at increasing concentrations. HSP90 was used as a loading control. p-MEK (top panel) and pERK1/2 (bottom panel) Western blot signals were quantified and plotted relative to untreated NS Control values. C, Western blot of serum-starved DFCI358 transduced with either non-silencing control (NS Control) or KRAS siRNA (KRAS KD) and induced with fetal bovine serum (FBS) at increasing concentrations. HSP90 was used as a loading control. p-MEK (lower left panel) and pERK1/2 (lower right panel) Western blot signals were quantified in Image Studio Lite and plotted relative to the value of untreated NS Control. D, AMMP™ based quantification of ligands in cell culture media conditioned by NS Control or KRAS KD DFCI358 cells, expressed as mean concentration of 3 biological and 3 technical replicates each. Error bars represent standard error of the mean. Asterisks denote statistically significant difference. E, Western blot of DFCI358 cells treated with crizotinib (criz), gefitinib (gef), or crizotinib/gefitinib combination, each at 1 μM, for 6 hours. GTP-KRAS levels were determined from a GST-Raf1-RBD pull-down, using the same lysates. HSP90 was used as a loading control. F, AMMP™ based quantification of ligands in cell culture media conditioned by DFCI358 cells treated with each drug at 1 μM, for 6 hours, expressed as mean concentration of 3 technical replicates. Error bars represent standard error of the mean. Only ligands and conditions with values above level of detection (LOD) are shown. G, AMMP™ based quantification of ligands in cell culture media conditioned by DFCI358 cells treated with each drug at 0.5 μM, for 24 hours, expressed as mean concentration of 2–3 technical replicates. Error bars represent standard error of the mean. Only ligands and conditions with values above level of detection (LOD) are shown. H, Starved DFCI358 cells were treated with PBS (Uninduced) or supernatants collected from either DFCI358 NS Control or DFCI358 KRAS KD. Western blot shows induction of pEGFR and pERK1/2 in DFCI358 treated with supernatant from NS Control, while pAKT is induced by KRAS KD supernatant. I, Dose-response growth and viability curve of empty vector-transduced (JP1698) and KRAS-FLAG overexpressing (KRAS FL) Hs746T derivatives treated with dose-escalated crizotinib for 3 days, assessed by MTS assay. J, AMMP™ based quantification of ligands in cell culture media conditioned by empty vector-transduced (JP1698) or KRAS-FLAG overexpressing (KRAS FL) Hs746T derivatives treated with crizotinib at 0.5 μM, for 24 hours, expressed as mean concentration of 2–3 technical replicates. Error bars represent standard error of the mean. Only ligands and conditions with values above level of detection (LOD) are shown. Asterisks denote statistically significant difference.
