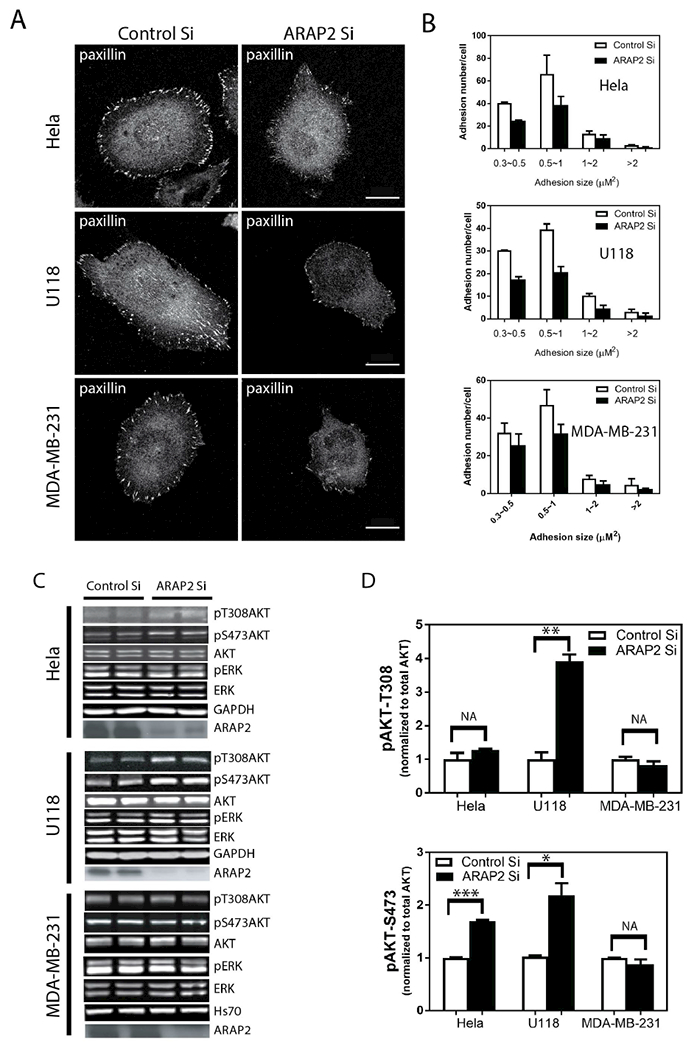
Figure 3. Lack of correlation between effects of ARAP2 on FAs and pAkt. (A, B) Effect of reduced ARAP2 expression on FAs.

Hela, U118 and MDA-MB-231 cell were treated with either a control siRNA or ARAP2 siRNA for 72 hours, then plated onto fibronectin (10 μg/ml) coated coverslips for 5 hours. The cells were immunostained for paxillin to detect FAs. FAs in the indicated size ranges were counted as described in “Materials and Methods.” Representative images (A) and quantification (B) expressed as the mean±S.E. from three experiment are shown. In each experiment, approximately 20 cells were imaged, yielding a total of 60-65 cells from each condition for the quantification. Scale bars, 20 μm.
(C, D) Effect of reduced ARAP2 expression on pAkt and pErk. Cells treated with siRNA as described in (A) were lysed and total cell lysates were analyzed by immunoblotting with antibodies to the indicated proteins. Representative blots (C) and quantification of the signals using the Odyssey infra-red system (LI-COR) are shown.
