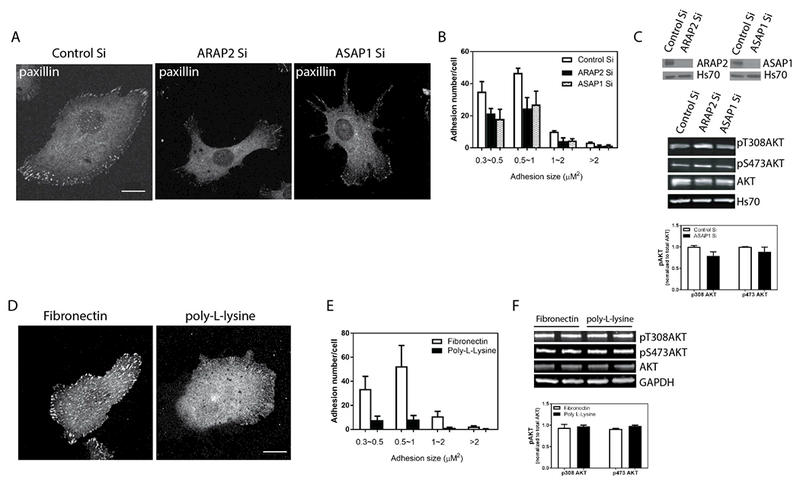
Figure 6. Changes in pAkt are independent of changes in FAs. (A, B and C) Reduced expression of ASAP1 reduces FA size but does not affect pAkt.

U118 cells were treated with siRNA for ARAP2 or ASAP1 and plated on fibronectin. The effects on FAs and on pAkt levels were determined. Representative images (A) and quantification of FAs (B), 20-22 cells in each of 2 experiments, are shown. (C) The upper panel is an immunoblot for ARAP2 and ASAP1, as indicted, of lysates of cells treated with siRNA targeting ARAP2 or ASAP1; the middle panel is a representative experiment showing the immunoblot of pT308Akt, , pS473Akt, total Akt and ASAP1; the lower panel is the summary of 3 experiments quantified by densitometry. The error bars are SEM. (D, E and F) Effect of integrin ligand on FAs and pAkt in U118 cells. U118 cells were plated on fibronectin or poly-L-lysine for 5 hours in serum free Opti-MEM prior to fixation or lysis. FAs and pAkt levels were analyzed as in Figure 5. Representative images (D) and quantification of FAs (E), 20-22 cells in each of 2 experiments are shown. (F) Upper panel is a representative immunoblot for pT308Akt, pS473Akt and total Akt and the lower panel is a summary of three experiments in which the immunoblots were quantified by densitometry. Error bars are SEM. Scale bars, 20 μm.
