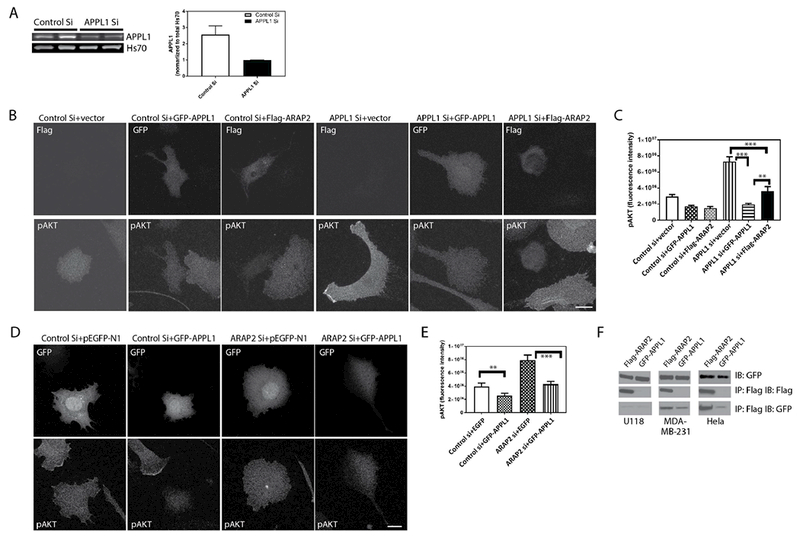
Figure 7. APPL1 and ARAP2 depend on each other for regulation of Akt. (A, B and C) ARAP2 rescues the effect of APPL1 knockdown on pAkt.

U118 cells treated with control or APPL1 siRNA and with expression vectors for either GFP-APPL1 or Flag-ARAP2 were plated on fibronectin for 5 hours in serum free medium prior to lysis and analysis of pS473Akt levels by quantitative IF. A. Left panel: Representative blot showing reduced APPL1 levels with siRNA treatment. Right panel: Quantification of immunoblot signals using using the Odyssey infra-red system (LI-COR). B. Representative images of cells. The upper panels are images indicating the transfected cells by GFP signal or by staining for Flag epitope. The lower panels are the cells stained for pS473Akt. C. Summary of three experiments. pAkt was quantified for 20-22 cells in each condition in three experiments. Error bars are SEM. (D and E) APPL1 rescues the effect of ARAP2 knockdown on pAkt. U118 cells were transfected with siRNA targeting ARAP2 and expression vectors for GFP-APPL1 or GFP (pEGFP-N1). D, representative images of cells in which pS473Akt was quantified are shown. The upper panels show cells with GFP signal to identify transfected cells. The lower panels are the cells stained for pS473Akt. E. shows the summarized quantitation of 20-22 cells for each condition from three experiments. Scale bars, 20 μm. F. Association of APPL1 and ARAP2 in three cell lines. U118, MDA-MB-231 and Hela cells were co-transfected with Flag-ARAP2 and GFP-APPL1. The cells were lysed after 24 h. Proteins from the lysates were immunoprecipitated (IP) with an antibody against the FLAG epitope, and the precipitates were immunoblotted (IB) with an antibody against FLAG or GFP. Error bars are SEM. **, p<0.01, ***, p<0.001.
