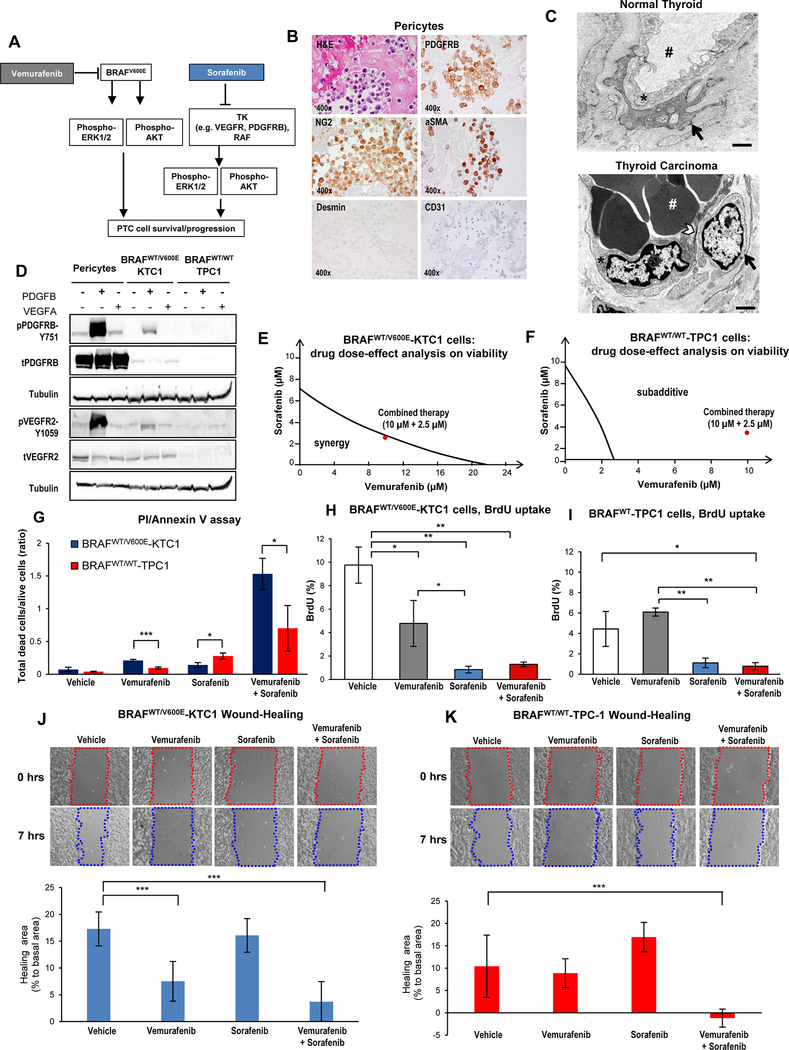
Figure 1. Combined therapy with vemurafenib plus sorafenib induces stronger cell death compared to single agent treatment in PTC cells.
(A) Diagram of targeted therapy with BRAFV600E inhibitor and tyrosine kinase (TK) inhibitors against human invasive thyroid carcinoma cells harboring the heterozygous BRAFV600E mutation. (B) Immunocytochemistry and Hematoxylin-Eosin (H&E) stained sections of formalin-fixed paraffin-embedded (FFPE) cell blocks of representative human pericytes in vitro. Immunocytochemistry staining shows cytoplasmic to membranous staining with antibodies against PDGFRB, NG2, and αSMA. Desmin and CD31 immunostain was negative. (C) Representative transmission electron microscopy (TEM). Above: venule from normal human thyroid shows a typical endothelial cell (asterisk) with vascular lumen (pound sign) filled with plasma and enveloped by a pericyte (black arrow). A small pericyte (arrow) surrounds the abluminal surface of the endothelium. Below: in contrast, venule from a well-differentiated human thyroid carcinoma (n=3) shows an endothelial cell (asterisk) with large, activated nucleus and thinned cytoplasm (arrowhead) enveloped by an activated pericyte (black arrow). Vascular lumen is filled with densely packed red blood cells (white pound sign) and with little plasma present, which is a characteristic sign [55] of vascular permeability to plasma. Scale bar size=500 nm. (D) Western blotting analysis (protein loading: 70 μg/lane) of protein expression levels in human BRAFWT-pericytes, BRAFWT/V600E-KTC1 and BRAFWT/WT-TPC1 cells at 20 minutes post stimulation with VEGF (20 ng/mL) or PDGFB (20 ng/mL). Both tubulin blots are different and derive from two different membranes. These results were validated by two independent experiments. (E-F) Visualization of drug combinations: dose-effect analysis of combined therapy with vemurafenib plus sorafenib vs. vehicle on BRAFWT/V600E-KTC1 and BRAFWT/WT-TPC1 cell viability (cells were grown in 0.2% FBS DMEM growth medium during treatment). Each point represents the mean of three replicates from two independent measurements. This method uses the dose-effect data of the individual drugs and drugs combined doses. The area of synergy or sub-additive effects is distinguished by the line (isobole curve), which indicates additive effects. The red dot highlights the best dose-effect using combined treatment with vemurafenib plus sorafenib. (G) Quantification of cell death by annexin V and propidium iodide (PI) dual staining assay in BRAFWT/V600E-KTC1 and BRAFWT/WT-TPC1 cells at 48 hrs treatment with DMSO (vehicle), 10 μM vemurafenib, 2.5 μM sorafenib and combined therapy with 10 μM vemurafenib plus 2.5 μM sorafenib; cells were grown in 0.2% FBS DMEM growth medium during treatment. These data represent the average ± standard deviation (error bars) of two independent replicate measurements (n=3 for each condition, *p<0.05, **p<0.01, ***p<0.001). (H-I) Quantification of cell proliferation by combined BrdU (5-bromo-2-deoxyuridine) pulse/PI (propidium iodide) by flow cytometry analysis of BRAFWT/V600E-KTC1 and BRAFWT/WT-TPC1 cells at 48 hrs treatment with DMSO (vehicle), 10 μM vemurafenib, 2.5 μM sorafenib and combined therapy with 10 μM vemurafenib plus 2.5 μM sorafenib; cells were grown in 0.2% FBS DMEM growth medium during treatment. These data represent the average ± standard deviation (error bars) of two independent replicate measurements (*p<0.05, **p<0.01). (J-K) Quantification of BRAFWT/V600E-KTC1 and BRAFWT/WT-TPC1 cell motility was analyzed by wound-healing assay. Cells were grown in 0.2% FBS DMEM growth medium during treatment. Images were captured at 0 and 7 hours after culture scratch. These data are representative of two independent replicate measurements calculating percentage of healing area at 7 hrs compared to 0 hrs (basal area) for each condition. Statistical analysis was performed comparing drug treatments vs. vehicle (**p<0.01, ***p<0.001).

